
Figure 2.
Comparison of 15N-1H HSQC spectra. Dots on top of the spectrum indicate whether a crosspeak was observed for each residue. (A) TIS11d (gray) and TIS11d-E220A (black), (B) TIS11d (gray) and TIS11d-Δ D219/E220 (black).
Official websites use .gov
A
.gov website belongs to an official
government organization in the United States.
Secure .gov websites use HTTPS
A lock (
) or https:// means you've safely
connected to the .gov website. Share sensitive
information only on official, secure websites.
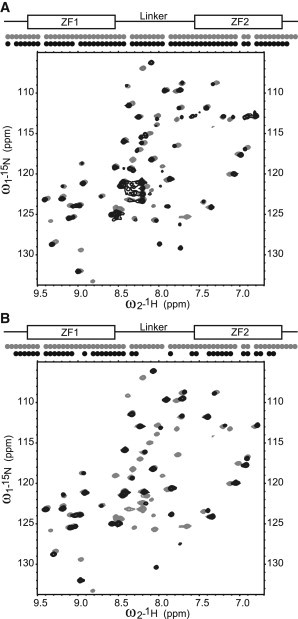
Comparison of 15N-1H HSQC spectra. Dots on top of the spectrum indicate whether a crosspeak was observed for each residue. (A) TIS11d (gray) and TIS11d-E220A (black), (B) TIS11d (gray) and TIS11d-Δ D219/E220 (black).