
Figure 3.
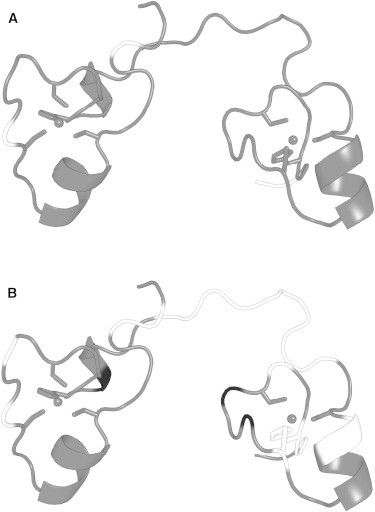
Crosspeaks with lost or reduced signal in the 15N-1H HSQC spectra of TIS11-E220A and TIS11d-Δ D219/E220 relative to WT TIS11d mapped on the initial NMR structure. Gray: residues with no significant change, black: residues with reduced signal, white: residues with no signal above the noise. (A) TIS11d-E220A and (B) TIS11d-Δ D219/E220.