
Figure 1.
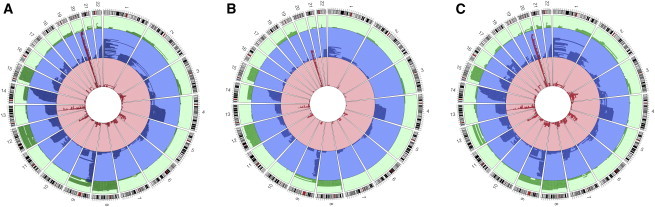
Genomic Locations of the Combined 1,334 Events Overall and by Cancer Status
Green indicates mosaic copy gains, blue represents mosaic copy-neutral events, and red represents mosaic losses.
(A) All 1,334 events from the combined GENEVA, TGSI, and TGSII analysis.
(B) Events in cancer-free control individuals.
(C) Events in individuals with solid tumors.