
Figure 5.
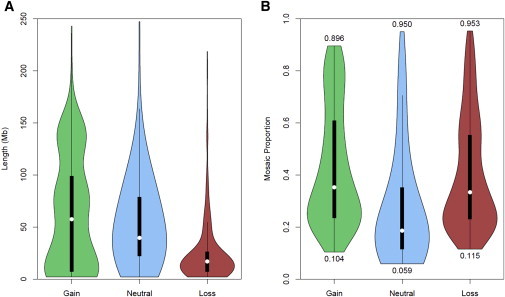
Event Size and Mosaic-Proportion Distribution across Copy-Number State
Violin plots of combined sample event size (A) and mosaic proportion (B) in relationship to mosaic copy gains, copy-neutral uniparental disomies, and copy losses. Boxplots with white circles denoting the median and thick black boxes representing the interquartile range are encapsulated in kernel density plots of the distribution of event length. Numbers below and above the violin plots of mosaic proportion (B) indicate the minimum and maximum detected range observed for each respective event’s copy-number state.