
Figure 2.
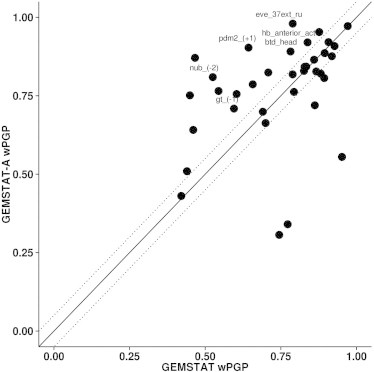
Evaluations of expression predictions from GEMSTAT and GEMSTAT-A. The goodness of fit between predicted and real expression for each enhancer was assessed by wPGP score, shown here for all 37 enhancers. Dotted lines delineate regions where the difference in wPGP between the two models is ≥0.05. A selection of enhancers where GEMSTAT-A improves fits are labeled and their expression patterns are shown in Fig. 3.