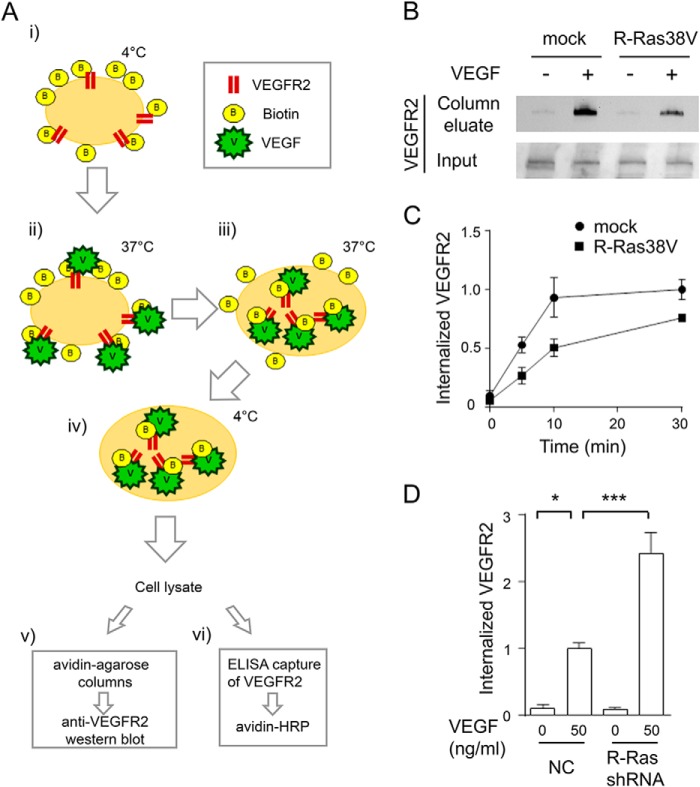
FIGURE 6.
Biochemical analyses of VEGFR2 internalization. A, schematic of the assays. i, endothelial cell surface proteins were biotinylated by Sulfo-NHS-SS-Biotin. ii and iii, cells were stimulated with VEGF-A to allow VEGFR2 internalization. iv, cells were then treated with non-permeable reducing agent to remove surface-bound biotin. Cell lysates containing internalized biotinylated proteins were analyzed by avidin-agarose column, followed by anti-VEGFR2 Western blot detection (v) or by ELISA capture of VEGFR2 followed by avidin-HRP detection (vi). B, detection of internalized VEGFR2 using the avidin column method (A, v). ECs were stimulated with or without 50 ng/ml VEGF-A for 10 min. Bottom panel, an aliquot of cell lysate was loaded directly onto SDS-PAGE to assess total VEGFR2 (Input). C, time course analysis with the ELISA capture method (A, vi). The cell surface-biotinylated ECs were stimulated with 50 ng/ml VEGF-A for the indicated times. The relative levels of VEGFR2 internalization are presented for each data point compared with the mock control at 30 min. D, R-Ras knockdown by shRNA increases VEGFR2 internalization. Cells were stimulated with or without 50 ng/ml VEGF-A for 10 min, and the internalized VEGFR2 was measured by ELISA method (A, vi). The -fold increase of internalization is presented as a relative value. NC, negative control shRNA.

