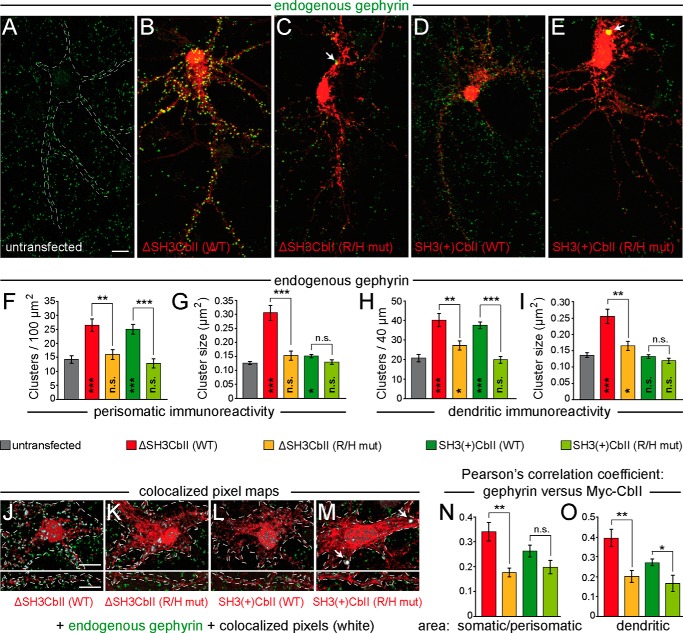
FIGURE 7.
The R/H mutation abolishes the enhancing effects of overexpressed ΔSH3CbII or SH3(+)CbII on the clustering of endogenous Gephyrin in cultured hippocampal neurons. A–E, cultured rat hippocampal neurons were transfected at DIV 4 with Myc-ΔSH3CbII (B), Myc-SH3(+)CbII (D), or their corresponding R/H mutants (C and E). Untransfected neurons (A) served as control. At DIV 14, the cells were fixed and immunostained for Gephyrin (green) and Myc (red) using the mAb7a (1:3,000; Connex) and the polyclonal rabbit antibody C3956 (1:1,000; Sigma-Aldrich), respectively. Silhouettes of somata and dendrites of untransfected neurons (indicated by dotted lines in A) were identified by massively increasing the brightness of the Gephyrin staining using ImageJ so that the cellular background signal became visible. Note the accumulation of Gephyrin in somatic aggregates (indicated by arrows) in neurons expressing the R/H mutants, as compared with untransfected neurons and to neurons expressing the corresponding WT isoforms. Scale bar, 10 μm. F and G, bar diagrams of perisomatic Gephyrin cluster densities per 100-μm2 surface area (F) and average sizes of perisomatic Gephyrin clusters (G). H and I, bar diagrams of the number of Gephyrin immunoreactive clusters per 40-μm dendritic length (H) and average sizes of dendritic Gephyrin clusters (I). Bars correspond to values obtained from the perisomatic surface area and one randomly selected second order dendrite (60–100 μm distal to the soma) (F) per neuron, respectively (n = 10–20 individual neurons from three independent transfection experiments). The data represent means ± S.E. n.s., not significant; *, p < 0.05; **, p < 0.01; ***, p < 0.001 (unpaired, two-tailed Student's t test). Significance levels compared with untransfected neurons are shown within the bars. J–M, exemplary overlapping pixel regions of selected somatic (top panels) and dendritic (bottom panels) areas from images of neurons expressing Myc-ΔSH3CbII (J), Myc-SH3(+)CbII (L), or their corresponding R/H mutants (K and M). Green (Gephyrin staining) and red (Myc staining) channels of selected image areas (as indicated by dotted lines) were automatically thresholded and processed using the colocalization threshold algorithm of the ImageJ software package The overlapping pixel regions were converted into a binary threshold mask (white) and superimposed on the original images as a colocalization map. Note the strong colocalization of the Myc-SH3(+)CbII R/H mutant with somatic Gephyrin aggregates (M, indicated by arrows) and the reduced colocalization of the Myc-ΔSH3CbII R/H mutant in both somatic and dendritic areas (K), as compared with WT ΔSH3CbII (J). N and O, Pearson's correlation coefficients were determined to quantify the levels of colocalization of each CbII variant. Red bars, Myc-ΔSH3CbII WT; orange bars, Myc-ΔSH3CbII R/H mutant; green bars, Myc-SH3(+)CbII WT; lime green bars, Myc-SH3(+)CbII R/H mutant) with Gephyrin in somatic/perisomatic (N) and dendritic (O) areas. The data represent means ± S.E. of n = 10 somata or dendrites of individual neurons. n.s., not significant; *, p < 0.05; **, p < 0.01 (unpaired, two-tailed Student's t test).

