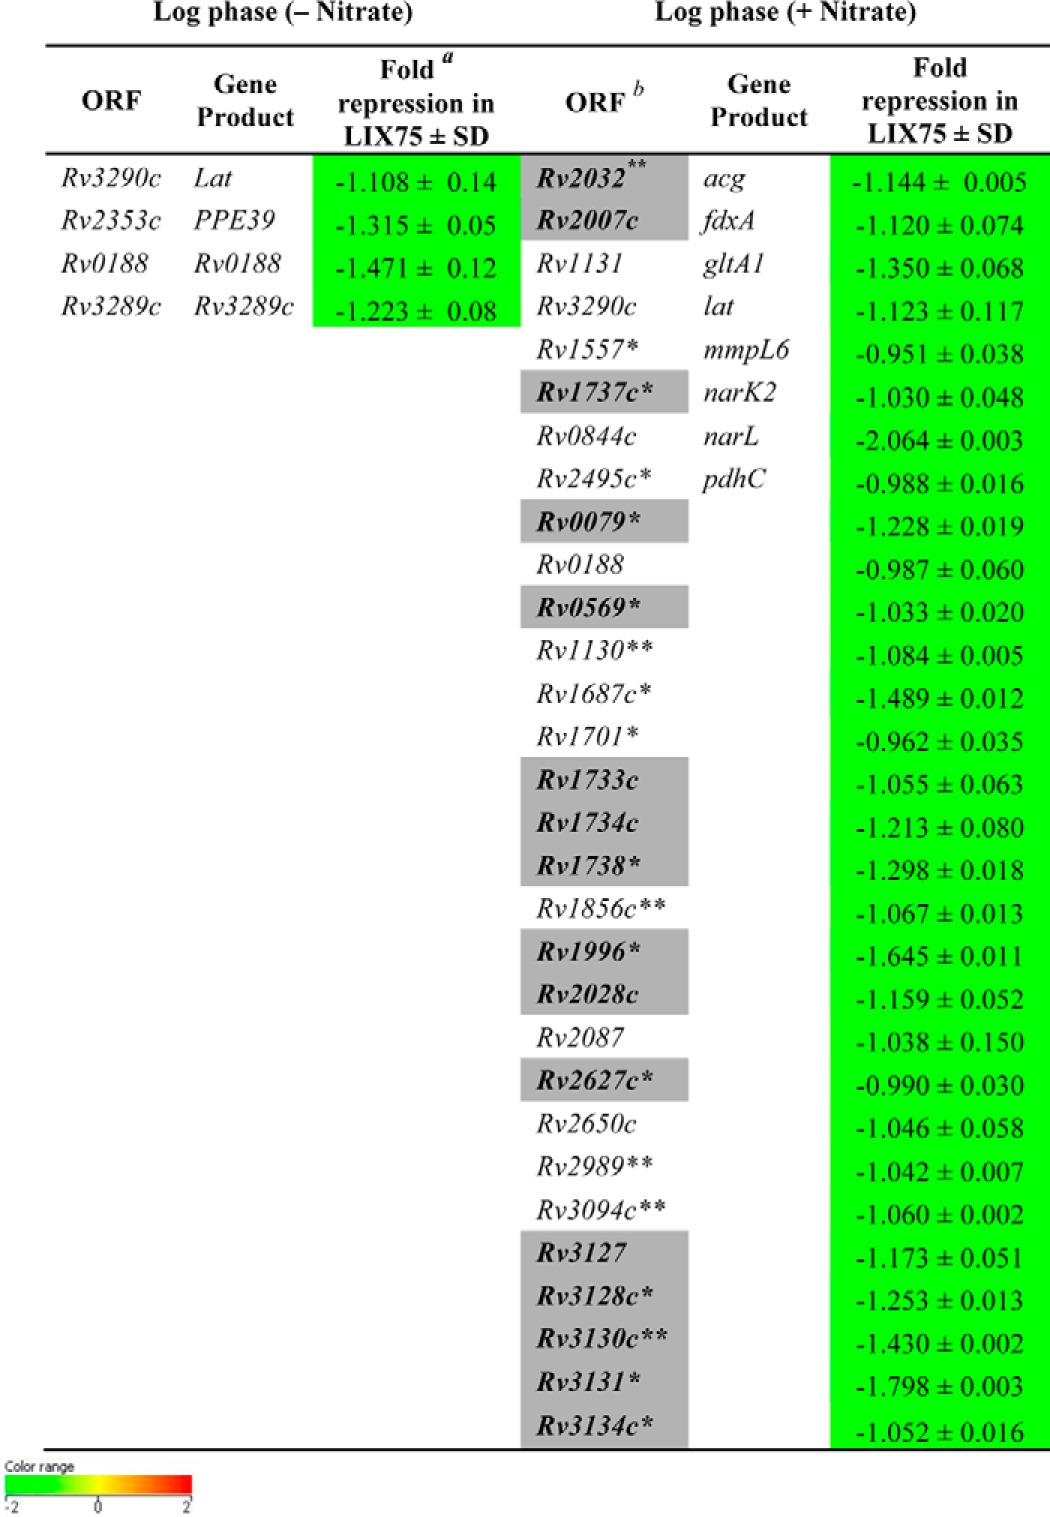
TABLE 3.
Genes down-regulated in ΔnarL mutant relative to H37Rv during aerobic growth (with or without nitrate)

a Geometric mean of log 2 ratio of expression in ΔnarL mutant relative to H37Rv under a specific condition ± S.D.
b Shaded boxes represent overlap with the hypoxia-induced and NO-induced DevR regulon (shown in boldface type) (8, 13). Green boxes indicate -fold change <−0.6 value in ΔnarL mutant relative to H37Rv.
*(p < 0.05), ** (p < 0.01), and *** (p < 0.001) (Student's t test) represent significant difference between ΔnarL mutant and H37Rv.
