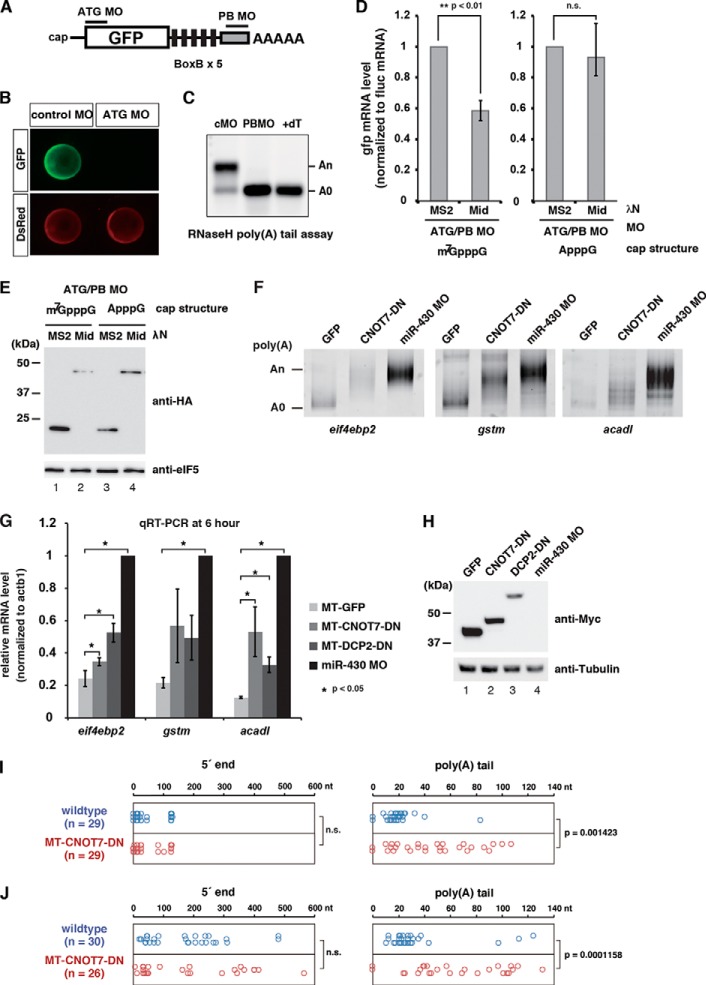
FIGURE 4.
Validation of the deadenylation-independent mRNA decay pathway in zebrafish embryos. A, schematic representations of the GFP reporter mRNA with BoxB sites and MOs used to analyze translation- and a poly(A) tail-independent mRNA decay by the TNRC6A Mid domain in zebrafish embryos. The translation-blocking MO (ATG MO) specifically masks the start codon of the GFP ORF. The polyadenylation-blocking MO (PB MO) binds to the end of the GFP mRNA and inhibits cytoplasmic polyadenylation during zebrafish embryogenesis. B, confirmation of the effect of ATG MO in zebrafish embryos. GFP and DsRed mRNAs were co-injected with MOs at the one-cell stage. GFP expression from the GFP reporter mRNA was completely blocked by ATG MO (green). Translation of co-injected DsRed mRNA was unaffected (red). Embryos are shown 10 h postfertilization. C, confirmation of the effect of PB MO in zebrafish embryos. GFP mRNA without a poly(A) tail was co-injected with MOs at the one-cell stage. The poly(A) tail length of the GFP mRNA was analyzed 4 h postfertilization by RNase H digestion and Northern blotting. Injected mRNA was polyadenylated after injection in the presence of control MO. PB MO completely blocked polyadenylation of the GFP mRNA. +dT, RNase H-treated sample in the presence of oligo(dT) (15), representing the completely deadenylated A(0) fragment. D, stability of the injected GFP reporter mRNA was determined by qRT-PCR 10 h after injection. Left, qRT-PCR analysis of the stability of reporter mRNA containing the 5′ m7G-cap. Right, qRT-PCR analysis of the stability of reporter mRNA containing the 5′ A-cap. GFP mRNA values were normalized against Fluc mRNA values. Normalized values of the experiments using HA-λN MS2 were set to 1. Graphs represent the means of three independent experiments. Error bars, S.D. The p value was calculated by using Student's t test. E, HA- and λN-tagged effector proteins used in D were detected by Western blotting using anti-HA antibody. eIF5 was served as loading control. F, poly(A) tail analysis of the endogenous miR-430 target mRNAs at 6 h postfertilization. mRNA encoding GFP or dominant-negative CNOT7 or MO against miR-430 was injected at the one-cell stage as indicated. The putative position of the A(0) product is shown on the left. G, qRT-PCR analysis of the miR-430 target mRNAs at 6 h postfertilization in the presence of GFP, dominant negative CNOT7, dominant negative DCP2, or miR-430 MO. mRNA levels were normalized against actb1. Normalized values of the experiments using miR-430 MO were set to 1. Graphs represent the means of three independent experiments. Error bars, S.D. The p value was calculated by using Student's t test. H, Myc-tagged effector proteins used in F and G were detected by Western blotting using anti-Myc antibody. Tubulin was served as loading control. I and J, cRACE analysis of eif4ebp2 mRNA at 5 h postfertilization in wild type (blue) and dominant negative CNOT7-injected embryos (red). Left panels, nucleotide position of 5′ end ligation junctions relative to the annotated eif4ebp2 transcript (ENSDART00000040926). Right panels, poly(A) tail length between the annotated 3′-UTR and ligated 5′ end. I, results of cRACE capturing capped mRNA; J, results of cRACE capturing decapped mRNA. The p value was calculated by using the Wilcoxon-Mann-Whitney test. n.s., not significant.

