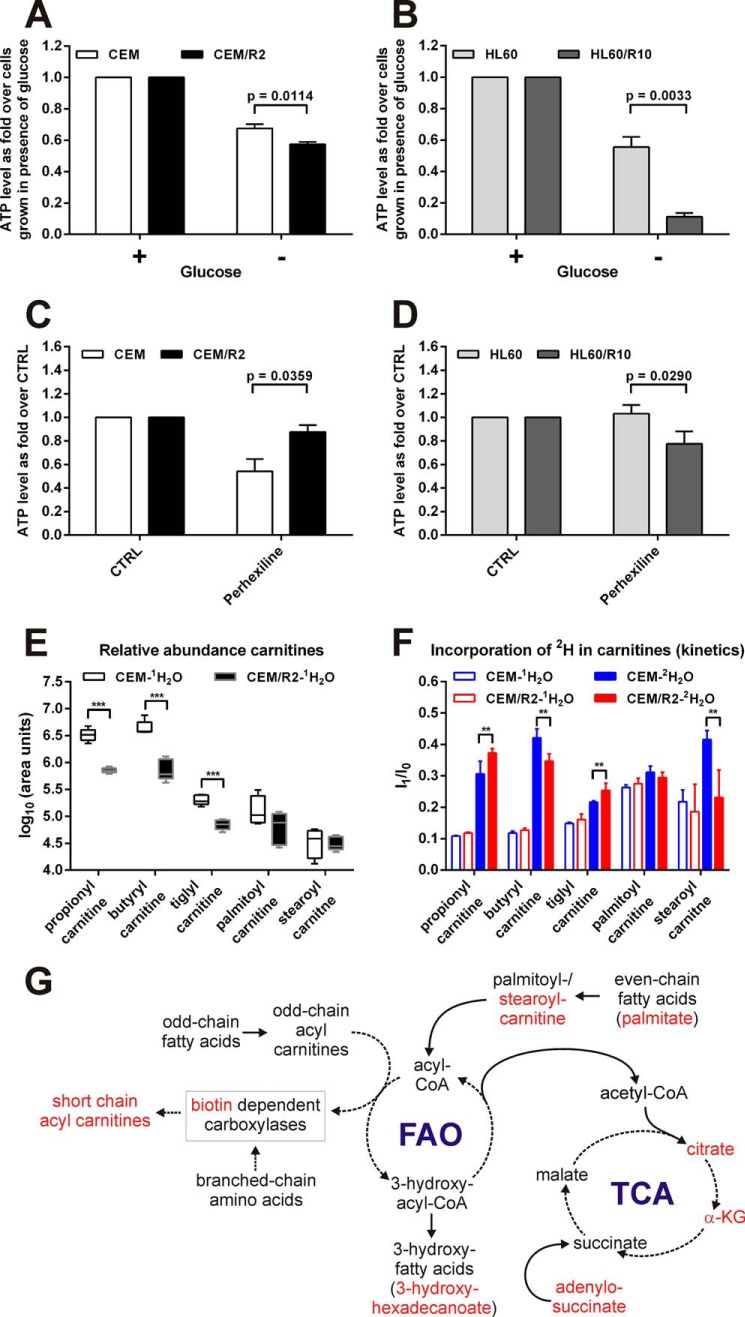
FIGURE 4.
Resistant leukemia cells are more vulnerable to glucose deprivation and differentially affected by carnitine palmitoyltransferase inhibitor perhexiline. Viability of CEM and CEM/R2 (A) (n = 5) or HL60 and HL60/R10 (B) (n = 3) cells that were grown for 72 h in RPMI with or without glucose. C, effect of 2.5 μm perhexiline on CEM and CEM/R2 viability (n = 4). D, effect of 5 μm perhexiline on HL60 and HL60/R10 cell viability (n = 3). A–D, cells were incubated for 72 h. Data shown as mean ± S.E. E, abundance (log10 of area units) for selected carnitines is shown in a box-and-whiskers plot (box represents 95% confidence interval, whiskers extend from the smallest to largest value and the line in the boxes represent the median of 5 technical replicates). F, de novo formation of selected carnitines estimated by growth in 2H2O medium. Ratio values represent isotopomer 1 (I1) over isotopomer 0 (I0) after 24 h growth in 2H/1H medium. Filled boxes are I1/I0 values from cells grown in 2H medium and open boxes are I1/I0 values representing cells grown in 1H medium. Data are presented as mean ± S.D. of 5 technical replicates. G, model for alteration in FAO/branched chain amino acid metabolism in resistant compared with sensitive cells. Highlighted in red are metabolites that exhibit a lower relative concentration or turnover rate in CEM/R2 (Figs. 3 and 4, E and F). A–F, p values were determined using a two-tailed unpaired t test. **, p ≤ 0.01; ***, p ≤ 0.001.

