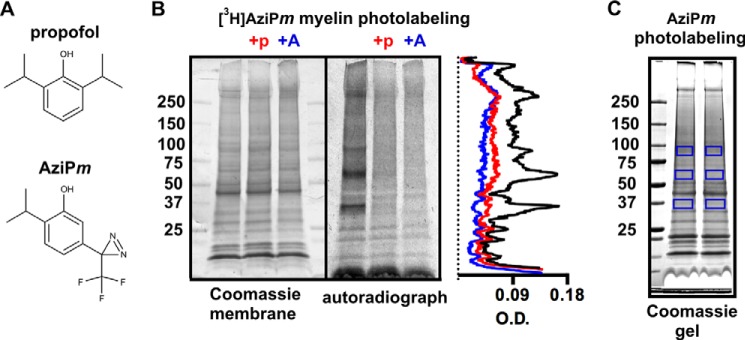
FIGURE 1.

A, chemical structures of propofol and AziPm. B, Coomassie R-250-stained membrane and corresponding autoradiograph of 50 μg of myelin protein separated with SDS-PAGE after photolabeling with 4 μm [3H]AziPm ± 400 μm propofol (+p) or 180 μm AziPm (+A). Optical density (O.D.) quantification from the autoradiograph lanes is shown in the aligned traces. C, Coomassie G-250-stained gel of 50 μg of myelin protein separated with SDS-PAGE after photolabeling with 4 μm (non-tritiated) AziPm. The boxed gel regions were excised for LC-MS/MS and processed with either trypsin or chymotrypsin digestion as described under “Experimental Procedures.”
