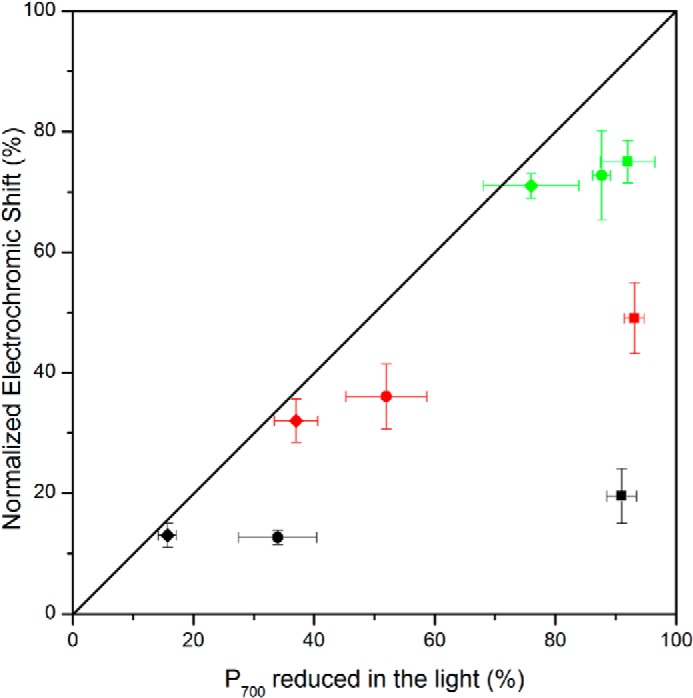
FIGURE 2.

Comparison of two different methods aimed at assessing the fraction of P700 involved in electron flow. The x axis is the fraction of P700 remaining reduced under illumination assessed as the ratio between the steady state light-induced absorption change and the maximum one measured under aerobic conditions. The squares, circles, and diamonds, respectively, show the data obtained after 5, 20, and 40 min of anoxia at different illumination intensities (20 μE·m−2·s−1, green; 55 μE·m−2·s−1, red; and 115 μE·m−2·s−1, black). The y axis is the relative amplitude of the electrochromic shift measured 140 μs after a saturating laser flash normalized to its maximum amplitude obtained in oxic conditions. The kinetics are the average of three independent experiments.
