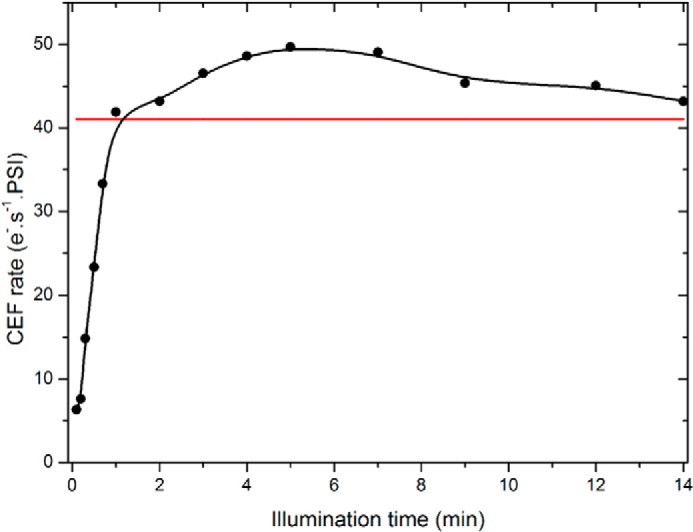
FIGURE 5.

CEF as a function of the duration of illumination in anoxia. The data points show the value of CEF measured as in Ref. 26 at discrete times after the onset of illumination in anoxic control cells. The red line shows the value of CEF reached after the spontaneous alleviation of the PSI acceptor limitation after 40 min of incubation in the dark. Three independent experiments were averaged, and the variation was below ±10%.
