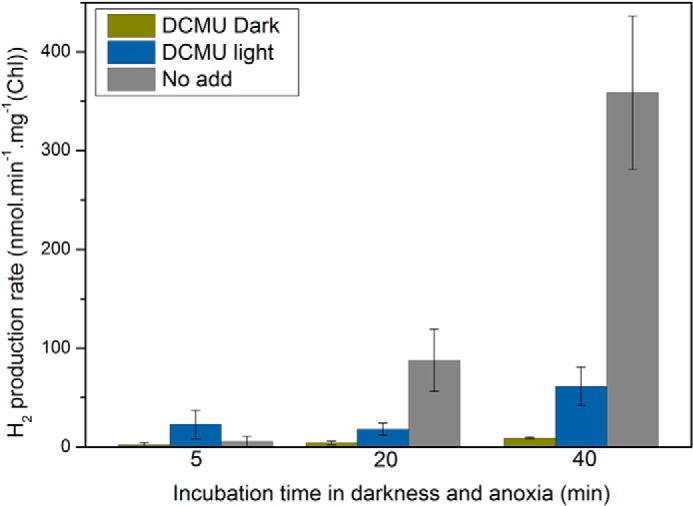
FIGURE 6.

Hydrogen production rates as a function of incubation time in anoxia. After the indicated incubation time, the hydrogen production rate was determined as the slope of the increase in hydrogen amount as a function of time. When the light-induced hydrogen production was measured, the light was applied for 1 min (100 μmol photons m−2 s−1) in presence or absence of DCMU (10 μm). All measurements were performed at least in triplicate, and data are presented as means ± S.D.
