
Figure 3.
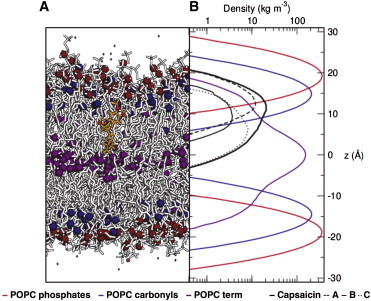
Localization of capsaicin within a model bilayer. During the course of simulations the location of capsaicin remained consistent (A) once it penetrated the bilayer. Here, a partial density profile (B) of 30 ns of simulation shows how capsaicin sits within a POPC bilayer. POPC phosphates, carbonyls, and terminal methyls are shown in red, blue, and purple, respectively. The capsaicin molecule is shown as a thick black line, and the distribution of the A, B, and C groups are shown as dashed, straight, and dotted lines, respectively. The A-group containing the phenol moiety aligns, on average, with the carbonyls of the POPC, whereas the rest of the molecule extends toward the center of the bilayer. To see this figure in color, go online.