
Figure 4.
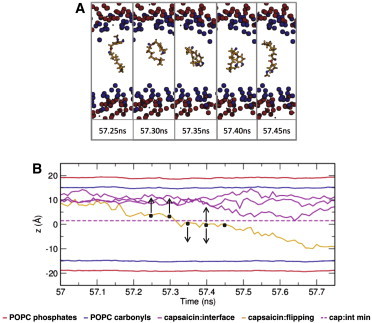
Capsaicin was seen to flip spontaneously from one bilayer to the other. (A) Snapshots of the flip-flop event. (B) Distance of the center of mass of a capsaicin molecule relative to the bilayer center versus time providing a more detailed view of the single capsaicin that flips from one bilayer to the other. POPC phosphates are shown in red, whereas carbonyls are shown in blue. Capsaicin molecules that did not flip are shown in magenta, with their closest approach to the center of the bilayer shown as a dotted magenta line. Snapshots of the flipping capsaicin were taken at either side of this line, indicated by black dots. The arrows indicate the directions of movement capsaicin in additional simulations (re)started at different time points along this transition (see main text and Fig. S2 for details). To see this figure in color, go online.