
Figure 4.
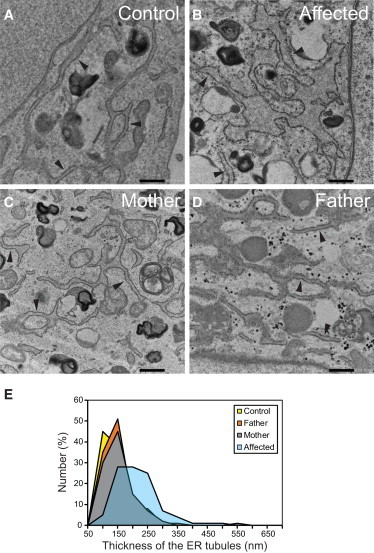
Dilation of ER in the Fibroblasts of the Affected Individual from Family 1
(A–D) Micrographs of thin-section electron microscopy for fibroblasts from control (A), affected individual (B), mother of affected individual (C), and father of affected individual (D). Tubular ER elements studded with ribosomes are indicated by arrowheads. Scale bars represent 500 nm.
(E) Summary of the thickness of ER tubules in fibroblasts. 100 nm in the x axis represents a thickness that is larger than 50 nm but equal to or less than 100 nm. The average thickness of the tubules is about 189 nm, 120 nm, 116 nm, and 125 nm for the cells from the affected individual (light blue), control (yellow), father (orange), and mother (gray), respectively. The ER tubules of the fibroblasts from the affected individual were thicker than those of other fibroblasts with statistical significance according to a one-way ANOVA with Tukey’s honest significant difference test (p < 0.01; n = 183 tubules for control, 212 for father, 171 for mother, and 181 for the affected individual).