
Figure 6.
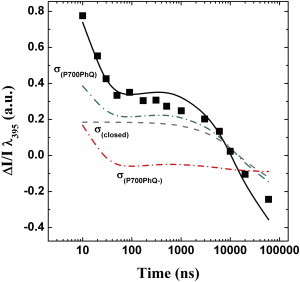
Simulation of pump-pump-probe kinetics in the PsaA-F689N mutant. The simulations (black line) are based on the fit of the pump-probe data (Fig. 1) and are compared with the experimental results (squares; as in Fig. 3, but without amplitude normalization). Also shown is the deconvolution of the contributions to the pump-pump-probe absorption difference kinetics from the various redox state fractions of the RC at the time of the second pump pulse: (dash-dotted red line), (dash-dotted blue-green line), and σclosed (dashed gray line). To see this figure in color, go online.