
Figure 4.
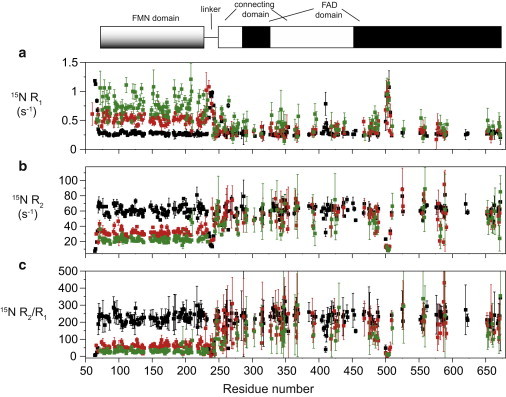
NMR 15N relaxation data collected at 950 MHz 1H frequency at T = 310 K and at various ionic strengths. (a–c) 15N R1, R2, and R2/R1 values, respectively. (Red squares) Relaxation data collected at 0.8 M and (green squares) 1 M NaCl concentrations. To facilitate the comparison with relaxation obtained at low ionic strength, we also represented the data measured previously at 0 M ionic strength (black) (5). (Top) The domain organization illustrates the linear localization of the FMN-domain, the linker region, and the intertwined FAD and connecting domains. To see this figure in color, go online.