
Figure 1.
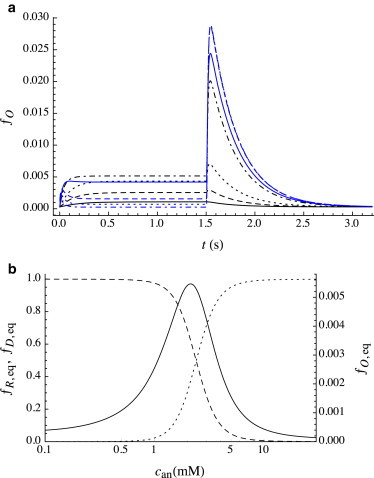
(a) Predicted open fraction ƒO(t) for a 1.5 s pulse of anesthetic for a wide range of concentrations: can = 0.5 mM (black solid line), 1.0 mM (black dashed line), 1.5 mM (black dotted line), 2.5 mM (black dot-dashed line), 3.0 mM (blue solid line), 5.0 mM (blue dashed line), 7.5 mM (blue dotted line), and 15.0 mM (blue dot-dashed line). (b) Equilibrium conformational distribution as a function of anesthetic concentration can: ƒO,eq (solid line), ƒR,eq (dashed line), and ƒD,eq (dotted line). Note the different scales for ƒO,eq (right ordinate) and for ƒR,eq and ƒD,eq (left ordinate). The shape of the distribution results from the increase in G(R) and the decrease in G(D) relative to G(O) upon bilayer adsorption of anesthetic. A key feature is the prediction of a very steep decrease in ƒO,eq after its maximum (i.e., for can > can,max ≈ 2 mM) as observed experimentally (9), which is inconsistent with a mechanism based on anesthetic binding to a channel-blocking site. To see this figure in color, go online.