
Figure 4.
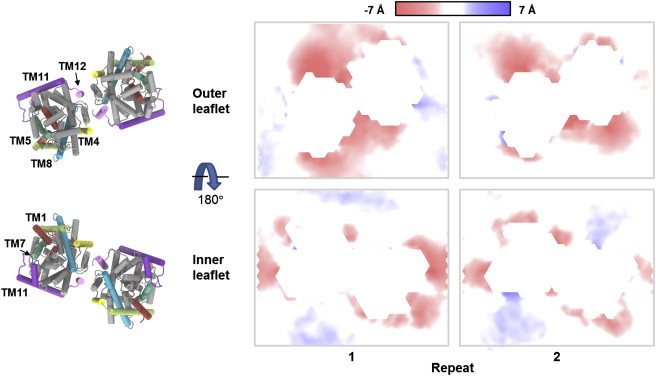
Local deviations from the average lipid membrane thickness. The average position of the ester oxygen atoms in the POPE lipids has been calculated on a grid with a 4 Å spacing and is shown as a surface colored according to deviations along the membrane normal. (Red and blue areas) Membrane thinning and thickening, respectively. The LeuT dimer at the end point of the WT-2 simulation is also shown with TM1 and the N-terminal (red), TM4 (yellow), TM5 (lime green), TM7 (green), TM8 (blue), TM11 and intracellular loop 5 (purple), TM12 (pink), and the remaining protein (gray). To see this figure in color, go online.