
Figure 2.
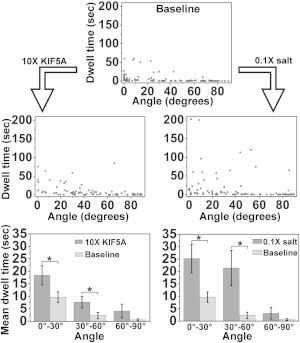
Effect of motor number on dwell times at MT intersections as a function of angles between undeformed MTs. Top: baseline assay (n = 109). Middle: assays with 10× motor number (n = 83) or low ionic strength (n = 95), as indicated by angled arrows. Bottom: comparison of mean dwell times in 30°-wide bins for top and middle panel data (error bars: mean ± SE). Significant increases are indicated by asterisks (left to right: p = 0.0496, 0.0088, 0.0044, 1.2e-4).