Figure 2.
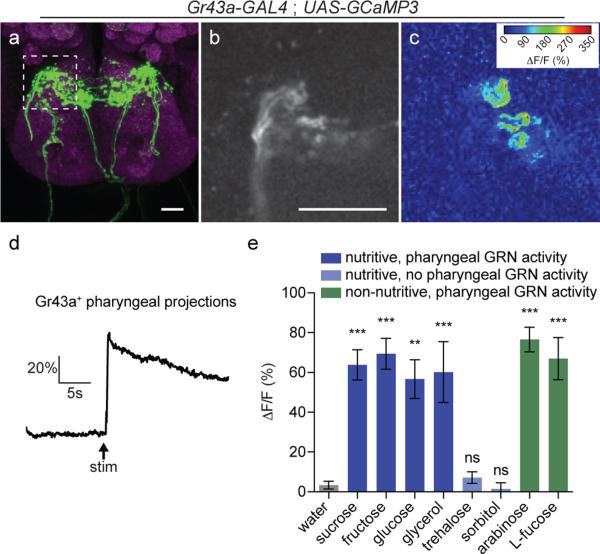
Pharyngeal GRNs respond to sweet compounds (a) Immunofluorescence of anti-GFP (green) and nc82 (magenta) in the SEZ of flies expressing GCaMP3 under control of Gr43a-GAL4. Dotted line shows area imaged in panel (b). (b) Single optical section of baseline GCaMP3 fluorescence in pharyngeal GRN axon terminals. Scale bars are 20 μm in a-b. (c) Heat map showing change in GCaMP3 fluorescence during ingestion of 1 M fructose. (d) Representative trace of fluorescence change of GCaMP3 in Gr43a axon terminals during ingestion of 1 M fructose. Arrow indicates time at which stimulus is applied to the proboscis to initiate feeding. (e) Peak fluorescence changes of GCaMP3 in Gr43a axon terminals during ingestion of 1 M solutions of the indicated compounds. Values represent mean +/− s.e.m. for n = 5 flies per stimulus (n = 4 for sorbitol), with data collected over at least 2 days. Asterisks indicate significant difference from water by one-way ANOVA with Bonferroni correction for multiple comparisons: **p < 0.01, ***p < 0.001, ns = not significant.

