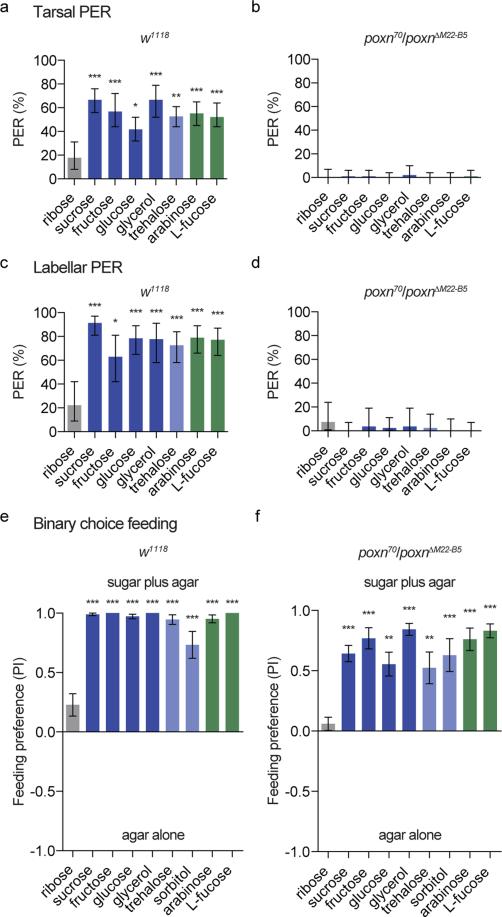
Figure 4.
poxn null mutants lack peripheral taste responses but prefer sweet compounds (a-d) PER responses of w1118 (a,c) and poxnΔM22-B5/poxn70 null mutant (b,d) flies following stimulation of the tarsi (a,b) or labellum (c,d) with the indicated compounds. Values represent percentage of stimulations resulting in a positive response; error bars show 95% binomial confidence interval, and asterisks indicate significant difference from ribose stimulation: * p < 0.05, ** p < 0.01, *** p < 0.001 by Fisher's exact test. n = 17- 50 flies for w1118 tarsal PER, n = 17-33 flies for poxn tarsal PER, n = 9-19 flies for w1118 labellar PER, and n = 9-17 flies for poxn labellar PER. (e,f) Preference of w1118 (e) and poxnΔM22-B5/poxn70 null mutant flies (f) for 100 mM solutions of the indicated compounds in 1% agar versus agar alone. Values represent mean +/− s.e.m. for n = 10 groups of 10 flies each, with independent replicates performed over at least 2 days. Asterisks indicate significant difference from ribose preference by one-way ANOVA with Bonferroni correction for multiple comparisons: **p < 0.01, ***p < 0.001.

