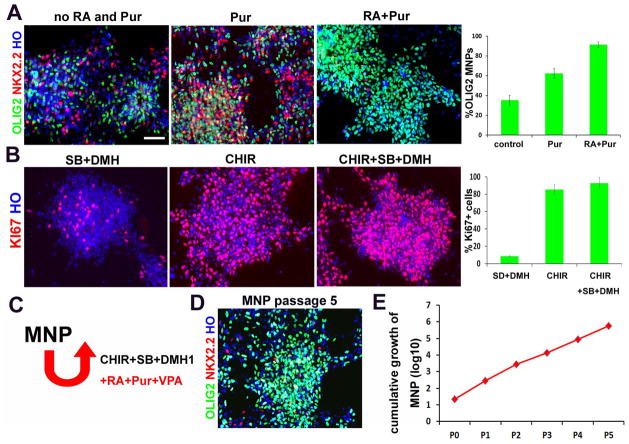
Figure 2. Expansion of OLIG2+ MNPs.
(A) Representative images of pure OLIG2+ (green)/NKX2.2+ (red) MNPs maintained under different conditions. Scale bars: 50μm. Quantification of OLIG2+/NKX2.2− cells is shown on right (>500 cells from random fields were manually counted in each condition). The bar graph shows the mean±s.d. (n=3 in each condition). (B) Representative images of Ki67+ (red) proliferating progenitors maintained under different conditions. Scale bars: 50μm. Quantification of Ki67+ cells is shown on right (>500 cells from random fields were manually counted in each condition). The bar graph shows the mean±s.d. (n=3 in each condition). (C) Schematics showing the expansion of MNPs with the combination of small molecules. (D) Representative images of MNPs expanded for at least 5 passages yet maintained the OLIG2 (green) expression. (E) Cumulative hPSC-derived MNP counts over five passages (passages denoted p1–p5). One 6-well of cells were manually counted in each passage, and total cell numbers were calculated by times passage ratio.

