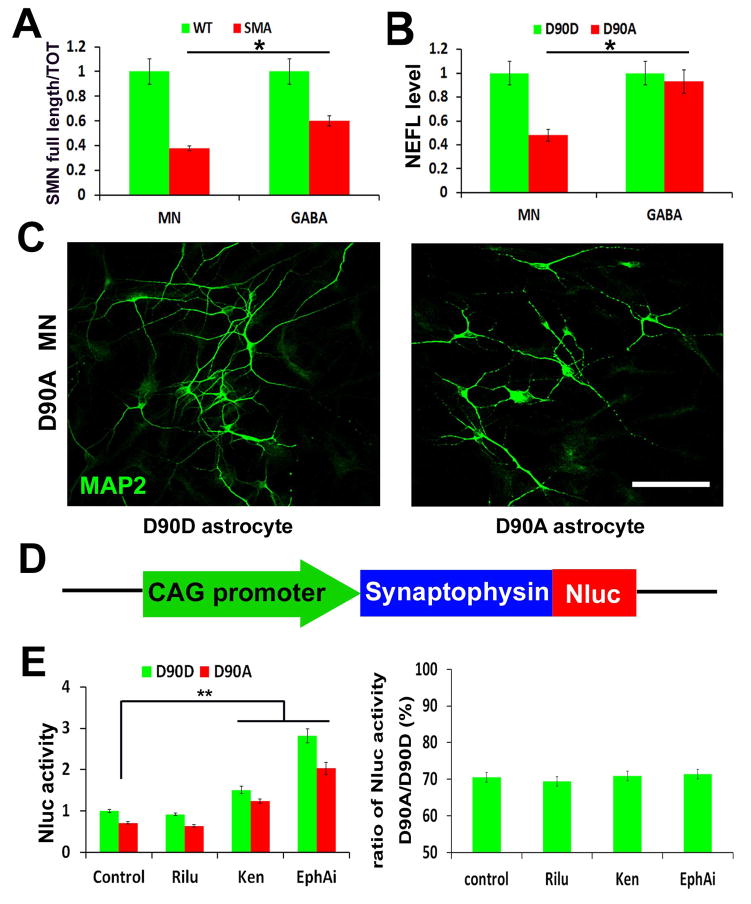
Figure 4. Enriched MNs for disease modelling and screening.
(A) The qPCR quantification of the ratio of full length SMN vs. total SMN in wildtype (WT) and SMA disease MNs, GABA neurons. The bar graph shows the mean±s.e.m. (*p<0.05, t-test, n= 3 in each group). (B) The qPCR quantification of NEFL mRNA level in ALS (D90A) and corrected (D90D) MNs, GABA neurons. The bar graph shows the mean±s.e.m. (*p<0.05, t-test, n= 3 in each group). (C) Representative image of ALS (D90A) MNs when culturing on ALS (D90A) astrocytes and corrected (D90D) astrocytes, which showed neurite fragmentation and reduced neurite length. Scale bars: 50μm. (D) Schematics of SYP-Nluc reporter. (E) Quantification of Nluc activity (left panel) and ratio (right panel) of SYP-Nluc reporter MNs on ALS (D90A) and corrected (D90D) astrocytes, when comparing between the control, Riluzole (Rilu), Kenpaullone (Ken) and EphA inhibitor (EphAi) groups. The bar graph shows the mean±s.e.m. (** P<0.01, Tukey’s test, n= 8 in each group).

