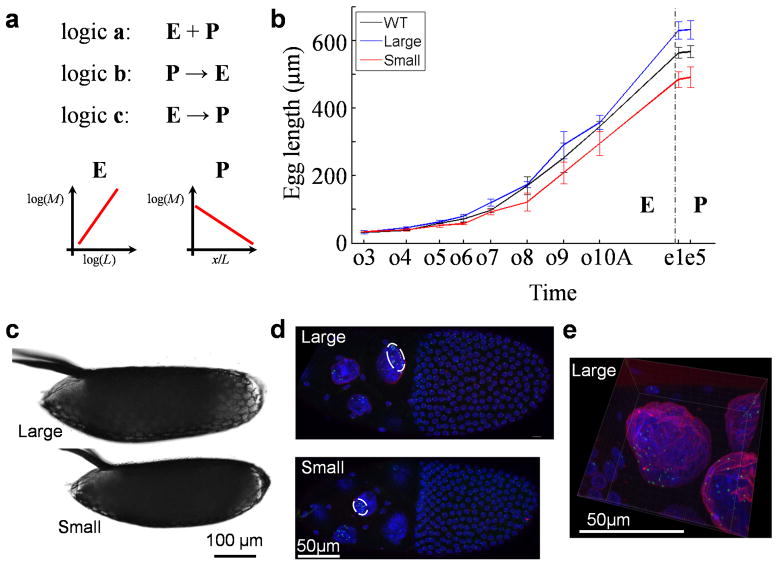
Fig. 1. Investigating tissue expansion properties during oogenesis in Drosophila.
a) Diagrams depicting three basic temporal logics governing the relationships between tissue expansion (E) and patterning (P) within a time period of interest. A symbolic plot capturing each system’s fundamental feature is shown. For the depicted system E, where M refers to a given type of molecules (e.g., mRNA or protein) that accumulate in quantity in relation to the 1-D size, L, of the system, the slope shown is the scaling power, n, of the molecules. For the depicted system P, where M refers to morphogen molecules that form an exponential concentration gradient along the normalized length, x/L, of the patterning system, the slope shown is -Γ, negative of the system attribute (see Results for additional details). b) Measured lengths of egg chambers and embryos. WT, Large and Small denote w1118, large- and small-egg inbred lines, respectively (shown in black, blue and red, respectively). Error bars are standard deviations and sample numbers are 50 (embryos) or ≥ 4 (egg chambers) for each of the three lines at each of the stages shown. Student’s t-tests suggest significant between-strain differences in lengths (p-values < 0.05) as early as oogenesis stage 6. c–d) Freshly laid eggs (c) or stage-10A egg chambers (d) from inbred lines. White circle in (d) marks the cluster of the detected bcd DNA FISH dots (green) within a nurse cell nucleus (DAPI in blue; WGA in red; see Methods). e) Higher magnification of a stage-10A egg chamber. Scale bars are 100 μm (for panel c) and 50 μm (for panels d and e).

