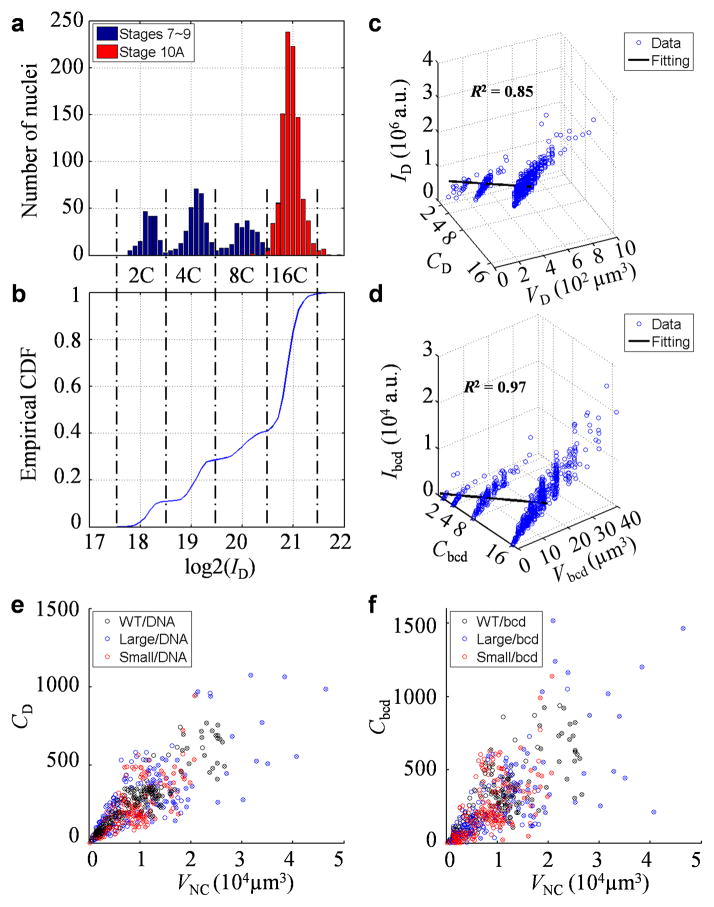
Fig. 2. Quantification of bulk nuclear DNA and bcd gene copy number in nurse cells.
a–b) Histogram (a) or empirical cumulative function (b) of nuclear DAPI intensity of the calibrating cells (1,649 follicle cells; see Methods). Dashed lines mark boundaries between subpopulations with the expected genome polyploidy of 2C, 4C, 8C and 16C. Datapoints from egg chambers at stages 7–9 or stage 10A are shown in blue and red, respectively. c–d) Scatter plots showing a two-parameter linear fit, I = aC + bV, for nuclear DAPI intensity (c) or bcd DNA FISH dot intensity (d). e–f) Scatter plots showing linear relationship between genome polyploidy equivalent (e) or bcd gene copy number (f) and nurse cell nuclear volume. Datapoints for stage 10A are marked by crosses; color code: black, blue and red for WT, large-egg line and small-egg line, respectively. The estimated polyploidy equivalents per egg chamber at stage 10A are 5.7 ± 0.5, 6.1 ± 0.5 and 4.6 ± 0.3 ×10³ in WT, large-egg line and small-egg line, respectively (values are mean ± s.d.). They are consistent with previous estimates 44 considering that our calibration methods adjust for volume-dependent background intensities (see Methods). The estimated bcd gene copy numbers are given in Main text. Consistent with the analysis of egg lengths (Fig. 1b), Student’s t-tests suggest significant differences in either genome polyploidy equivalent (p-value = 10−6 between WT and the small-egg line, and 0.04 between WT and the large-egg line) or bcd gene copy number (p-value = 0.04 between WT and the small-egg line, and 0.12 between WT and the large-egg line). In addition, both the average polyploidy equivalents and bcd copy numbers of different lines show correlation with the average nurse cell nuclear volumes (Pearson correlation coefficients = 1.00 and 0.99, p-values = 0.05 and 0.09, respectively; p-values from Pearson coefficient calculation).

