
Fig. 3. Expansion of gene locus clusters in expanding nurse cell nuclei.
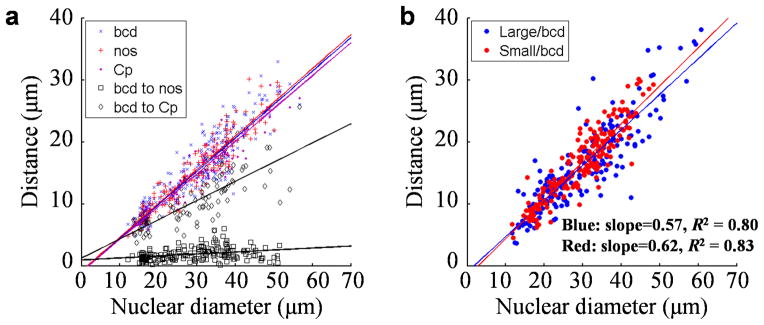
a) Scatter plots of the observed cluster size for individual gene loci (bcd, nos or Cp, shown in blue, red and purple, respectively), or the observed distance between two clusters (bcd-nos or bcd-Cp, shown in black and gray, respectively), against nurse cell nuclear diameter (see Methods for definition of cluster size and distance between clusters). Data are from WT egg chambers at stages 6~10A. Solid lines are linear fits. Blue: y = 0.54x – 0.92 μm, R2 = 0.86; red: y = 0.54x – 0.84 μm, R2 = 0.89; purple: y = 0.53x – 0.99 μm, R2 = 0.85; black: y = 0.03x + 0.94 μm, R2 = 0.09; gray: y = 0.31x + 1.25 μm, R2 = 0.57. b) The cluster size of bcd DNA FISH dots against nurse cell nuclear diameter in two inbred lines. See Supplementary Fig. 6 for spatial properties of gene loci in follicle cells.