
Figure 1.
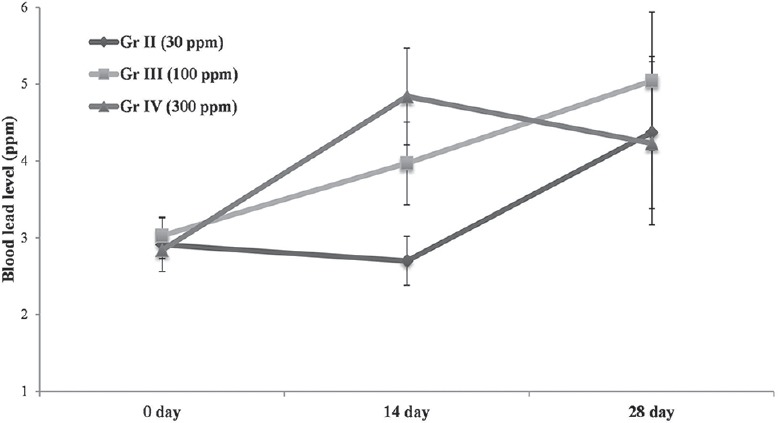
Blood lead levels in rats after 14 and 28 days of exposure at 30, 100, 300 ppm in drinking water. Data are presented as mean ± standard error of the mean (SEM) vertical bars represents SEM
Official websites use .gov
A
.gov website belongs to an official
government organization in the United States.
Secure .gov websites use HTTPS
A lock (
) or https:// means you've safely
connected to the .gov website. Share sensitive
information only on official, secure websites.
Blood lead levels in rats after 14 and 28 days of exposure at 30, 100, 300 ppm in drinking water. Data are presented as mean ± standard error of the mean (SEM) vertical bars represents SEM