
Figure 4.
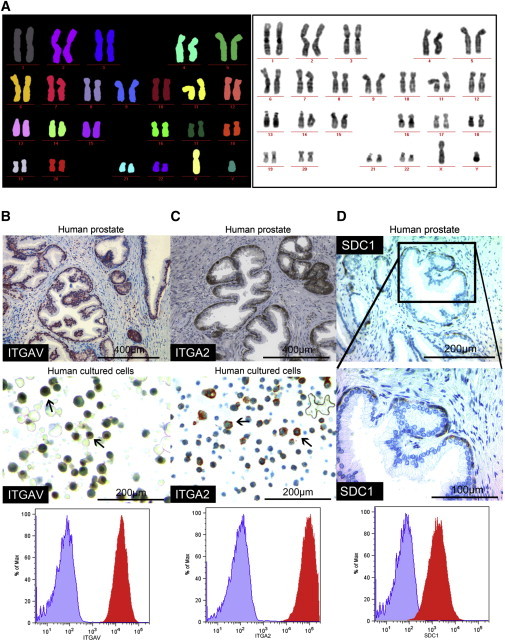
Genetic Stability of PESCs and Histologic Validation of FACS Array Screen-Identified Proteins in Human Prostate Glands
(A) M-FISH analysis of human PESCs in culture demonstrates a normal male karyogram (46,XY) with no signs of chromosomal aberrations; 24-color fluorophore-labeled metaphase chromosomes and their discrimination after visualization and computerized output.
(B and C) Staining for ITGAV and ITGA2 in primary human prostate and cultured human PESCs by IHC; surface expression on cultured human PESCs as determined by FACS.
(D) Exclusive expression of SDC1 in the human prostate basal epithelial compartment in vivo as determined by IHC. FACS surface staining of SDC1 in cultured human PESCs. The FACS plot shows the staining intensity for the isotype control (purple) and the specific antibody (red).
See also Figure S4.