
Figure 1.
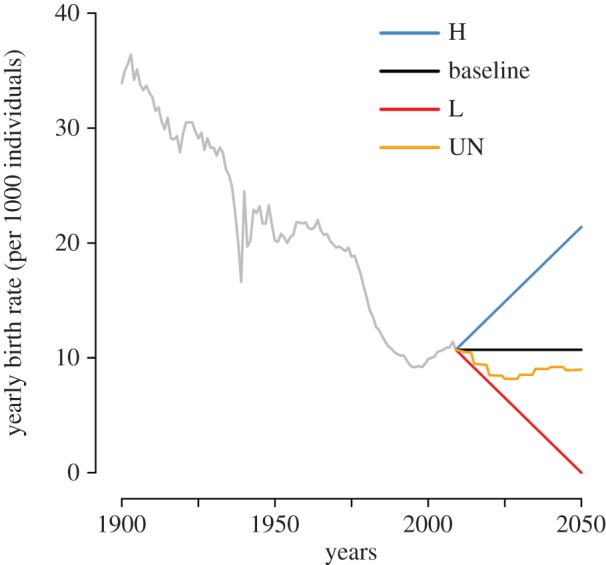
Birth rate over time in Spain. Yearly birth rate as observed in Spain during the period 1900–2009 (grey line), and as assumed by different prediction scenarios considered (2010–2050). Illustrative scenarios: H, baseline and L. Scenario based on published population projections of the UN [34].