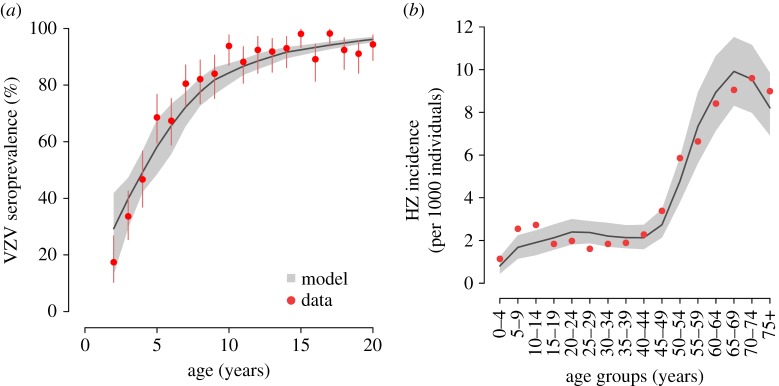
Figure 2.

VZV seroprevalence and HZ incidence. (a) Age-specific VZV seroprevalence as observed in data from Spain in 1996 [38] and as estimated by the model. Vertical lines represent 95% CI of the data computed by exact binomial test. (b) HZ incidence by age group as observed in 2005–2006 [39] and as estimated by the model. In both panels, grey areas show the 95% CI of model estimates.
