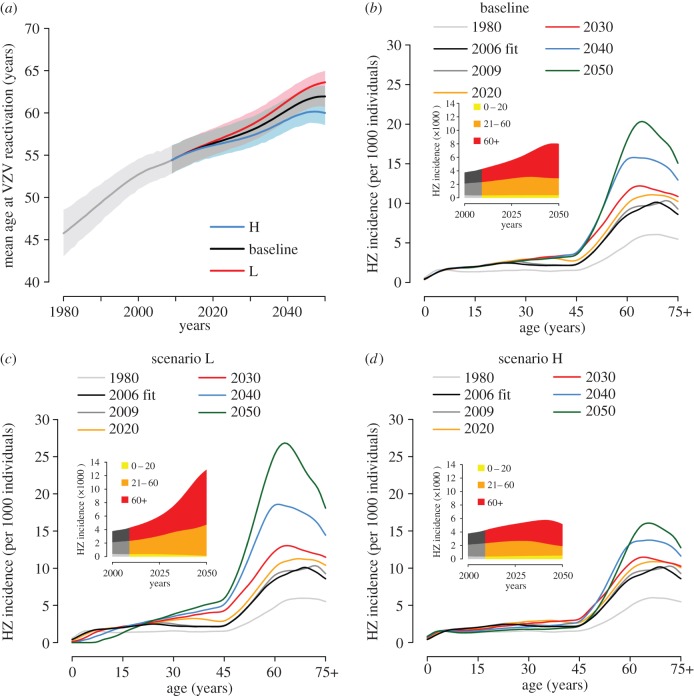
Figure 5.
Predicted impact of demographic changes on the future epidemiology of HZ (2010–2050). (a) Predicted mean age (and 95% CI, shaded areas) at HZ over time. Different colours correspond to different projection scenarios. (b–d) Predicted age-specific HZ incidence at different years for (b) the baseline scenario, (c) the ‘lowest birth rate’ scenario L and (d) the ‘highest birth rate’ scenario H. The insets show the total HZ incidence over time disaggregated by age group.

