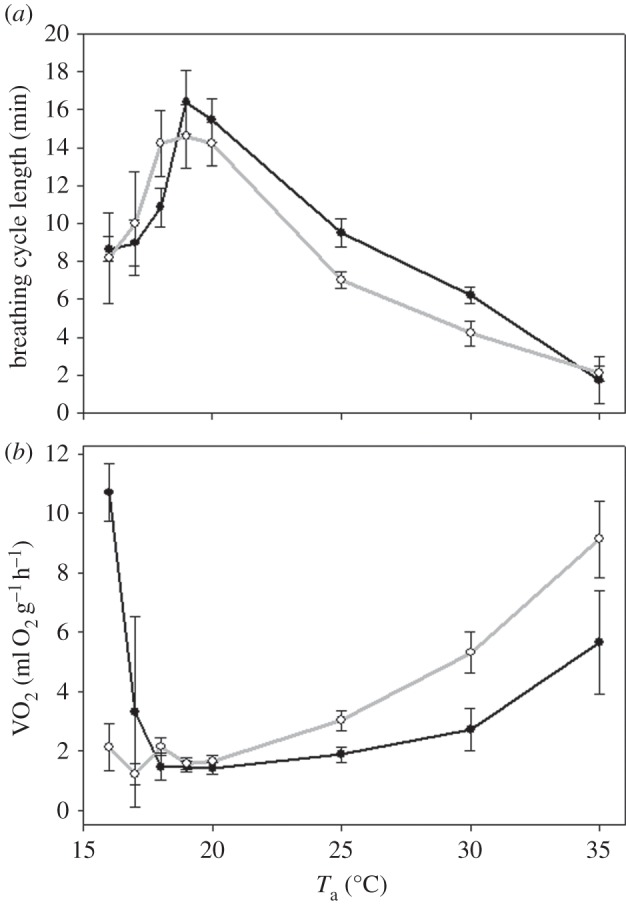
Figure 4.

Average (±s.e.) of (a) breathing cycle length (min) and (b) metabolic rates (oxygen consumption VO2 ml O2 g−1 h−1 of R. microphyllum (close symbols, black line) and Rhinopoma cystops (open symbols, grey line) at different temperatures: 20–35°C at 5°C intervals, 120 min at each temperature. For calculations, the last 30 min at each temperature were used. Asterisks (*) indicates significant difference from the other species, (**) indicates significant difference from 20°C in the same species, p < 0.05. Two-way repeated measure ANOVA with post hoc Holm–Sidak method.
