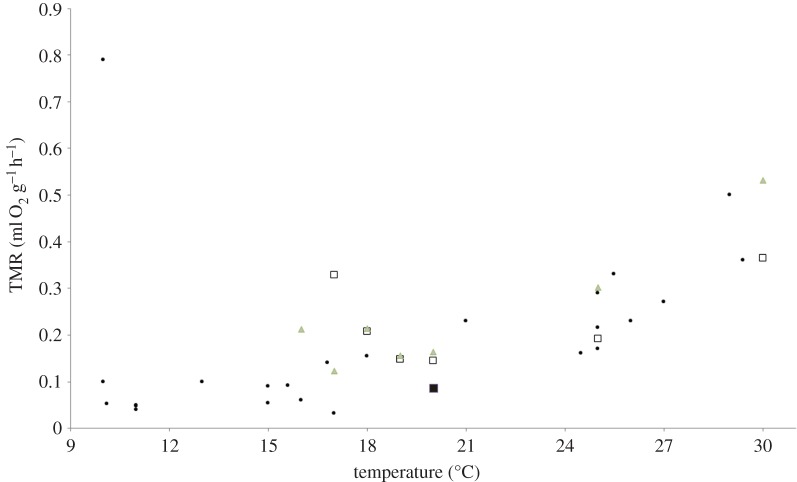
Figure 5.
Body temperature and metabolic rate in hibernating mammals in the temperature range of 10–30°C (black filled circles, data from [21]). Open squares, ambient temperature and TMR measured in Rhinopoma microphyllum on 2012, black square, on 2013. Grey triangles, ambient temperatures and TMR measured in Rhinopoma cystops on 2012. (Online version in colour.)

