. 2015 Feb 23;4:e04599. doi: 10.7554/eLife.04599

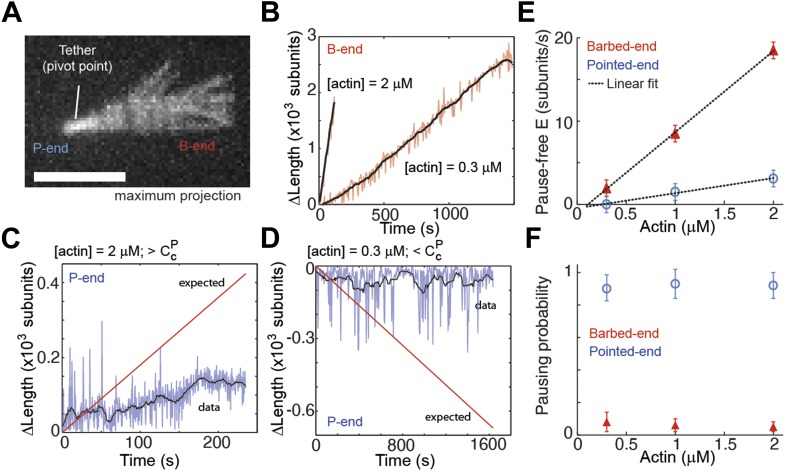
Figure 4. Intrinsic filament dynamics.

(A) A maximum projection image from a movie of an actin filament tethered to a glass surface via a single α-actinin molecule where the tethering position about which the filament swivels is visible as a constriction point. Scale bar: 3 μm. (B) Change in length of the barbed-end vs time for individual actin filaments attached to the surface using the lowest tethering protein surface densities at 300 nM and 2 μM concentrations of free actin monomers. (C–D) Change in length vs time of the pointed-ends of single, elongating actin filaments using the lowest tethering protein surface densities and either 2 μM (C) or 300 nM (D) of actin monomers free in solution. The red lines represent the expected elongation behavior based on previously reported rates using NEM-myosin as a tether (Kuhn and Pollard, 2005; Fujiwara et al., 2007). (E) The pause-free elongation velocity (E) plotted as a function of free actin concentration. The lines represent linear fits. Estimated rates are reported in Table 1. Error bars are s.e.m. (n > 20). (F) Pausing probability as a function of free actin concentration. Error bars represent s.e.m. (n > 20).

DOI: http://dx.doi.org/10.7554/eLife.04599.013

Figure 4.

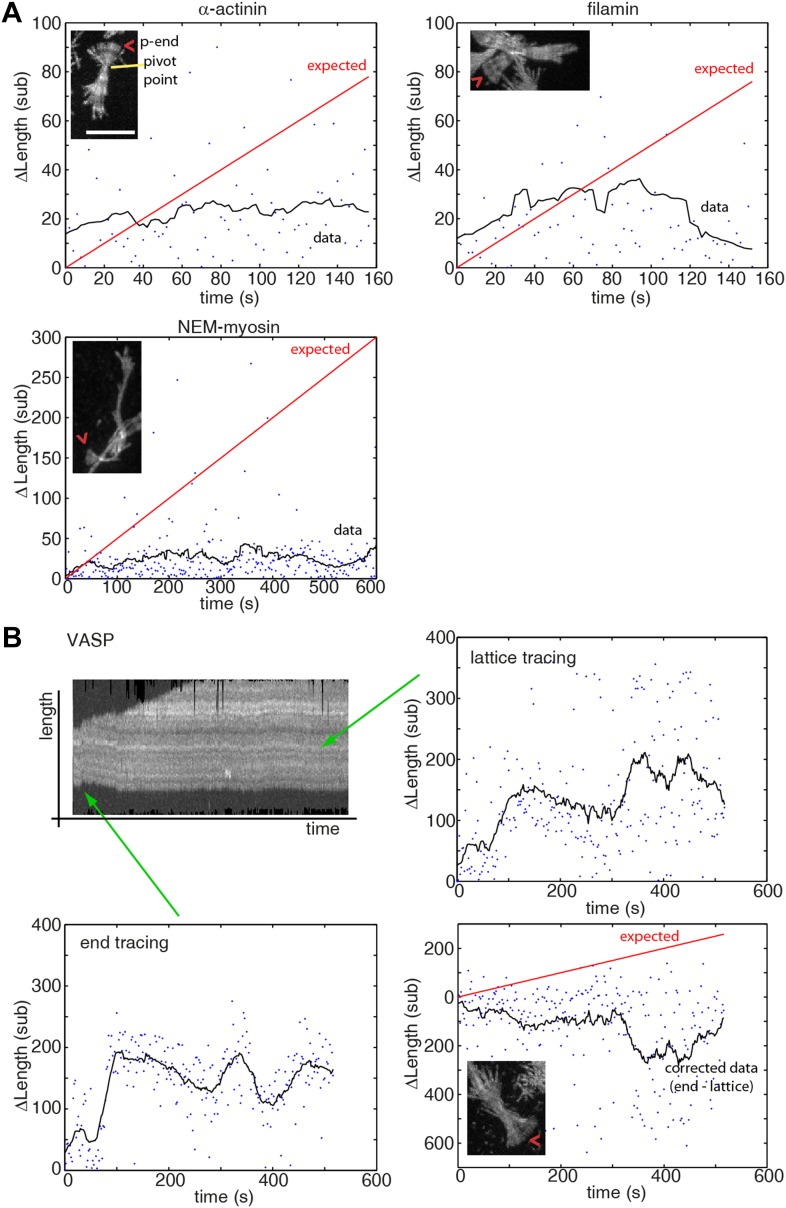
Figure 4—figure supplement 1. Pointed-end pausing on freely swiveling ends for various tethering proteins.

Figure 4—figure supplement 1.

(A–B) The change in length of the pointed-end of actin filaments as a function of time at 1 μM-free actin concentration are shown when using (A) α-actinin, NEM-myosin, filamin, and (B) VASP as tethering proteins. Points represent raw data while black solid lines correspond to a running mean with a window of 20 s. The solid red line is the elongation rate expected based on reported values. A maximum projection image from the respective movie is shown as inset. (B) (upper left panel) Kymograph of a growing filament showing lateral fluctuations due to weak binding of the filament to the tether. For accurate length determination with filament sliding, both the pointed-end (lower left panel) and a fiduciary marker (upper right panel) were tracked. The corrected data (lower right panel) shows mostly a paused state. Scale bar: 5 μm.
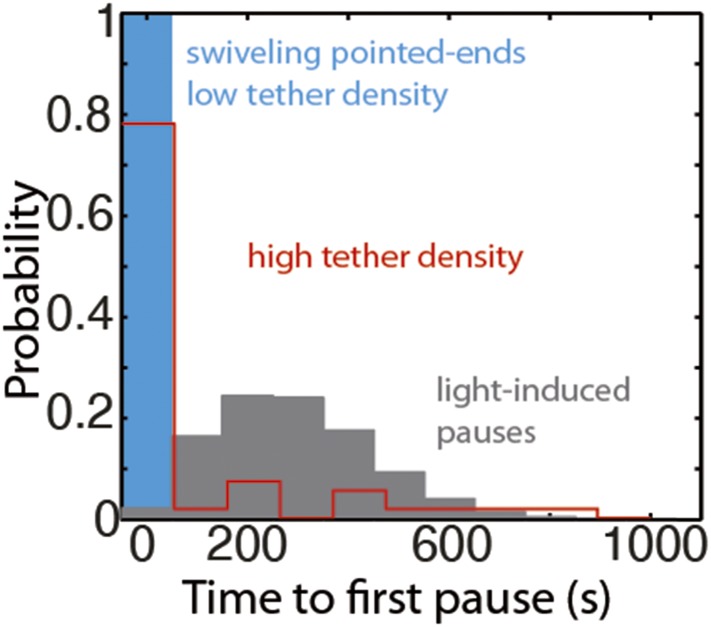
Figure 4—figure supplement 2. The distribution of the time to the first elongation pause at 300 nM free actin concentration.

Figure 4—figure supplement 2.

The distribution of the observed time to the first pause for depolymerizing pointed-ends at the lowest tether density (blue bar), at medium to high tether density (pooled data, red bars), or predicted using a model for light-induced dimerization (gray bars, see ‘Materials and methods’).
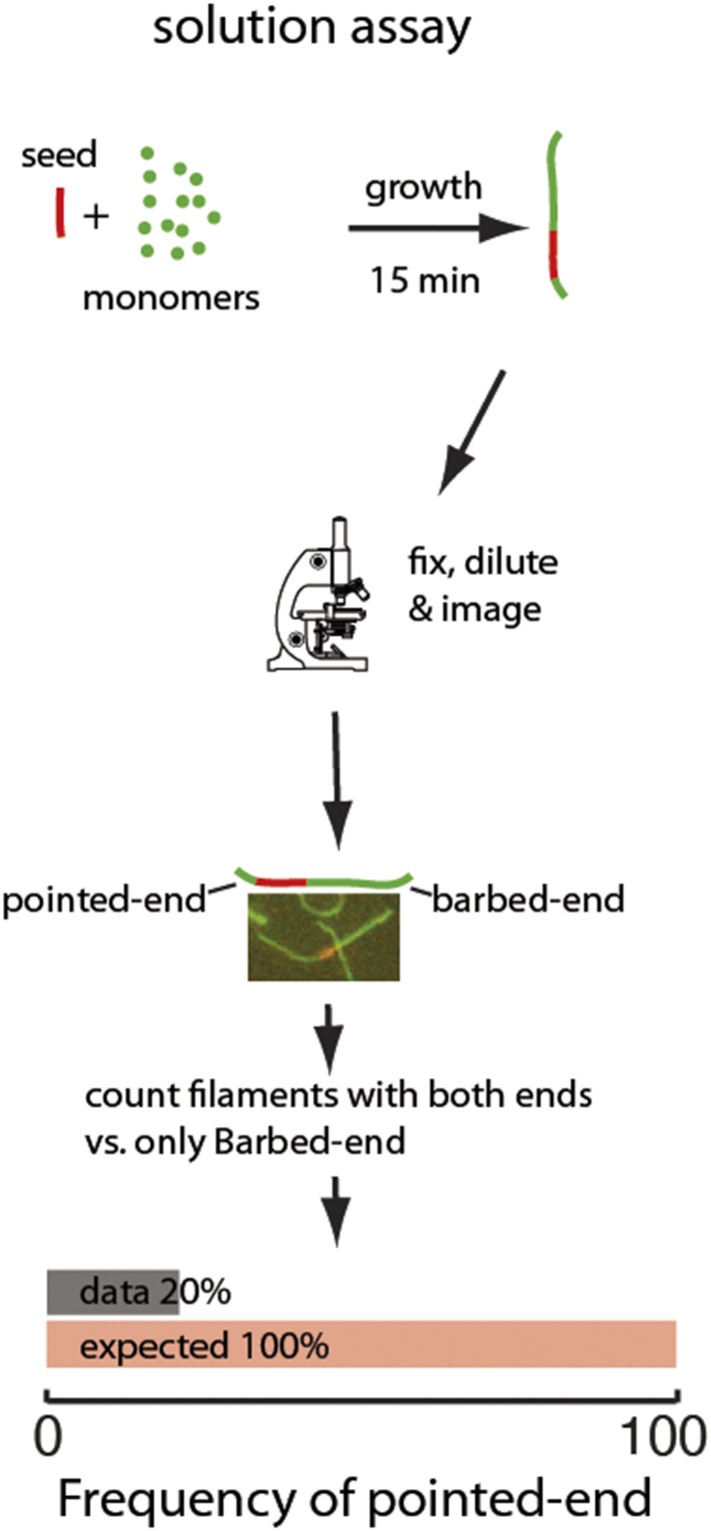
Figure 4—figure supplement 3. Two-color seeded assay for visualizing pointed-end growth from an actin filament seed.

Figure 4—figure supplement 3.

A schematic of the assay is shown. Actin filament fragments labeled in red with atto565 were used as seeds for filament growth in a solution of atto488-labeled (green) actin monomers. After 15 min, the reaction was stopped by addition of phalloidin and dilution to a final concentration below 200 nM of free monomers. Filaments formed during this time are therefore diluted and individual filaments can easily be visualized. The filaments exhibiting growth at the barbed-end or at both ends were counted. The last figure shows the results of the analysis: the observed (gray) frequency of filaments that exhibited pointed-end growth, 20% was significantly smaller than the predicted value (red) of 100% (n = 1000).