
Figure 4.
The cKIT+ Cell Population Derived from FLK1+ Hemangioblast Contains Erythroid, Myeloid, and Lymphoid Potential
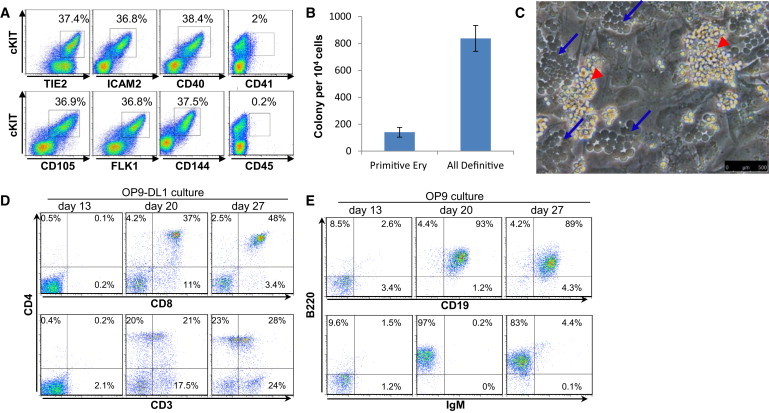
(A and B) FLK1+ cells sorted from day 3 EBs were seeded on gelatinized plates in serum-free media supplemented with BAV for the first day and then with BV from day 1 onward (B, BMP4; A, Activin A; V, VEGF). At day 2 of culture, cells were analyzed for the coexpression of cKIT with a panel of endothelium and hematopoietic cell-surface markers.
(B) Day 2 sorted cKIT cells were plated in clonogenic assay for hematopoietic precursors. Primitive Ery: primitive erythrocytes; all definitive colonies: macrophages, macrophages/erythrocytes, GM, and GEMM colonies. Data are presented as the mean number of colonies from three dishes; bars represent SEM.
(C) Bright-field picture taken at 1 week of culture. Blue arrows mark cobblestone areas; red arrowheads mark free-floating hematopoietic clusters.
(D) Cells derived from OP9-DL1 culture were stained at the indicated time for the coexpression of CD4, CD8, and CD3 marking T lymphocytes.
(E) Cells derived from OP9 culture were stained at the indicated time for the coexpression of B220, CD19, and IgM marking B lymphocytes. Data shown are representative of at least three experiments.
See also Figure S3.