
Figure 6.
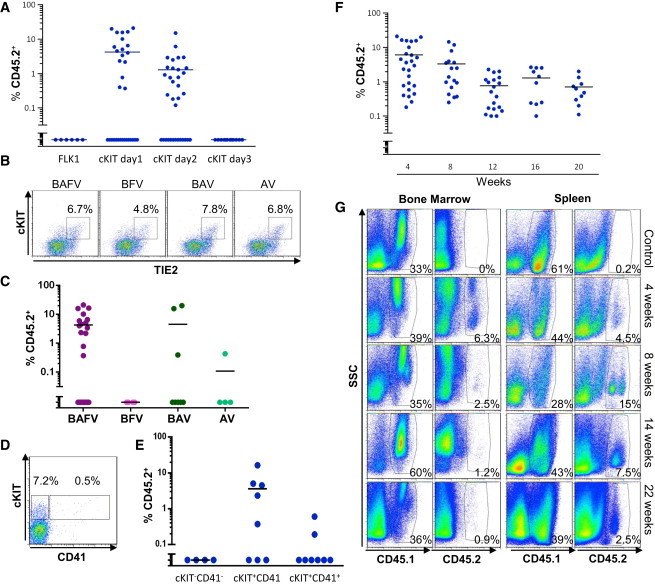
Successful Engraftment Is Highly Dependent on Cytokine Exposure
(A) Frequency of CD45.2+ cells (blue circles) in the blood of recipient mice 4 weeks after engraftment with the indicated population. The data presented in this graph for cKIT+ cells at days 1 and 2 were obtained under BAFV, BAV, and BAV-BV culture conditions. Each point represents one mouse; the number of experiments conducted for each population is shown in Table 1 (B, BMP4; A, ActivinA; V, VEGF; F, FGF2).
(B) Representative flow cytometric analysis of cKIT and TIE2 expression for cells obtained from day 1 FLK1 culture grown in the indicated cytokines.
(C) Frequency of CD45.2+ cells in the blood of recipient mice 4 weeks after engraftment with cKIT+ cells isolated from day 1 FLK1 culture grown in the indicated cytokine mix (BAFV, purple circles; BFV, pink circles; BAV, dark green circles; AV, light green circles). Each point represents one mouse; the numbers of mice and experiments are detailed in Table 1.
(D) Representative flow cytometric analysis of cKIT and CD41 expression for cells obtained from day 1 FLK1 culture grown in the presence of BAFV cytokines.
(E) Frequency of CD45.2+ cells (blue circles) in the blood of recipient mice 4 weeks after engraftment with the indicated cells isolated from day 1 FLK1 culture grown in the presence of the BAFV cytokine mix. Each point represents one mouse (n = 2, with 4 mice per experiment, except for group CD41−cKIT− with 2 mice per experiment).
(F) Frequency of CD45.2+ cells (blue circles) in the blood of recipient mice at the indicated number of weeks after engraftment. Data in this graph represent a summary of all recipients that successfully engrafted. Each point represents one mouse, n = 18 with 4 mice per experiment as detailed in Table 1.
(G) Flow cytometric analysis of CD45.1 and CD45.2 expression relative to side scatter (SSC) for bone marrow and spleen cells at the indicated weeks after engraftment.
See also Figure S6.