
Fig. 4. Multi-lineage engraftment and activity of gene-corrected HSPC.
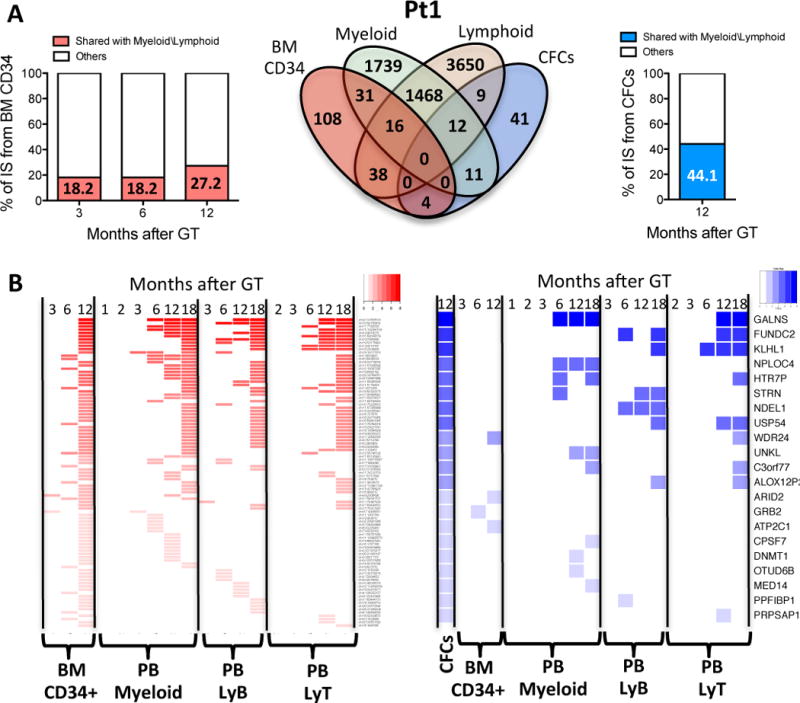
(A) Multi-lineage detection of identical IS. Venn diagram show overlaps among CD34+, myeloid, lymphoid cells and CFCs ISs datasets from Pt1. Column graphs show percentage of CD34+ cells and CFC ISs from Pt1 shared with myeloid\lymphoid lineages (red and blue portion of column respectively) at different months after gene therapy. (B) Detection of shared ISs over time. Heatmaps show CD34+ cells and CFCs ISs at different timepoint shared with the 4 lineages of panel A–C. Each column shows a lineage and a timepoint and each row a shared ISs belonging to CD34+ cells (red) or CFCs (blue). The intensity of colors indicates degree of ISs detection in multiple lineages and timepoints from highly shared ISs (high intensity of red and blue) to ISs shared with a single lineage and timepoint (light red or blue)