
Fig. 5. Comparative analysis of vector integration sites in patients treated by gene therapy with lentiviral or γ-retroviral vectors.
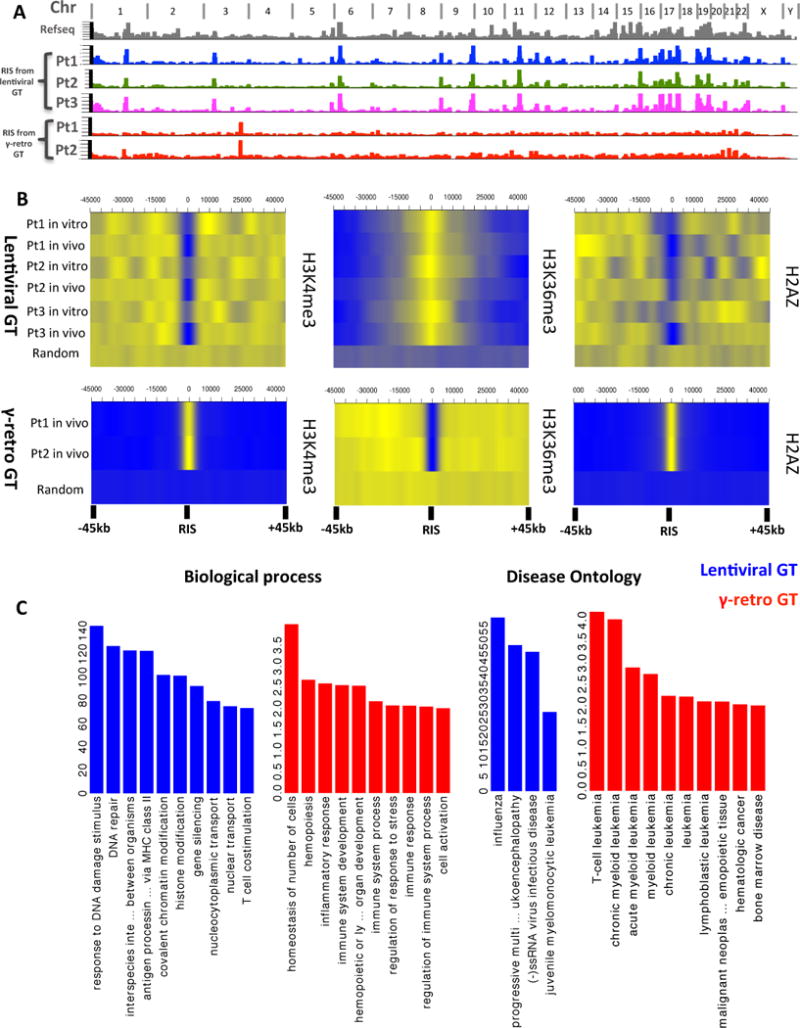
(A) Genomic distribution of ISs from five patients with WAS, treated by lentiviral (n=3) or γ-retroviral (n=2) vectors. Chromosome names are reported on top of the graph. Refseq Genes and ISs frequency distributions are shown in bins of 1Mbp (grey, colored/red columns respectively). (B) Chromatin modifications surrounding ISs. Probability density distributions of histone modifications mapped on CD34+ cells in a +/−45kb window surrounding IS are shown as heatmaps. Color intensity show under (blue) or over (yellow) representation of each given histone modification as compared to random in silico generated reference. Each row represents an in vitro or in vivo ISs dataset from the patients treated with lentiviral or γ-retroviral vectors. (C) Gene Ontology of genes proximal to ISs. Biological process and Diseases significantly associated to the functions of genes proximal to ISs in lentiviral and γ-retro gene therapy are represented as blue and red bars, respectively. The values on y-axis show the fold enrichment scale for gene ontology categories.