
Fig. 6. Common insertion sites and oncogenic hits in lentiviral vs γ-retroviral gene therapy.
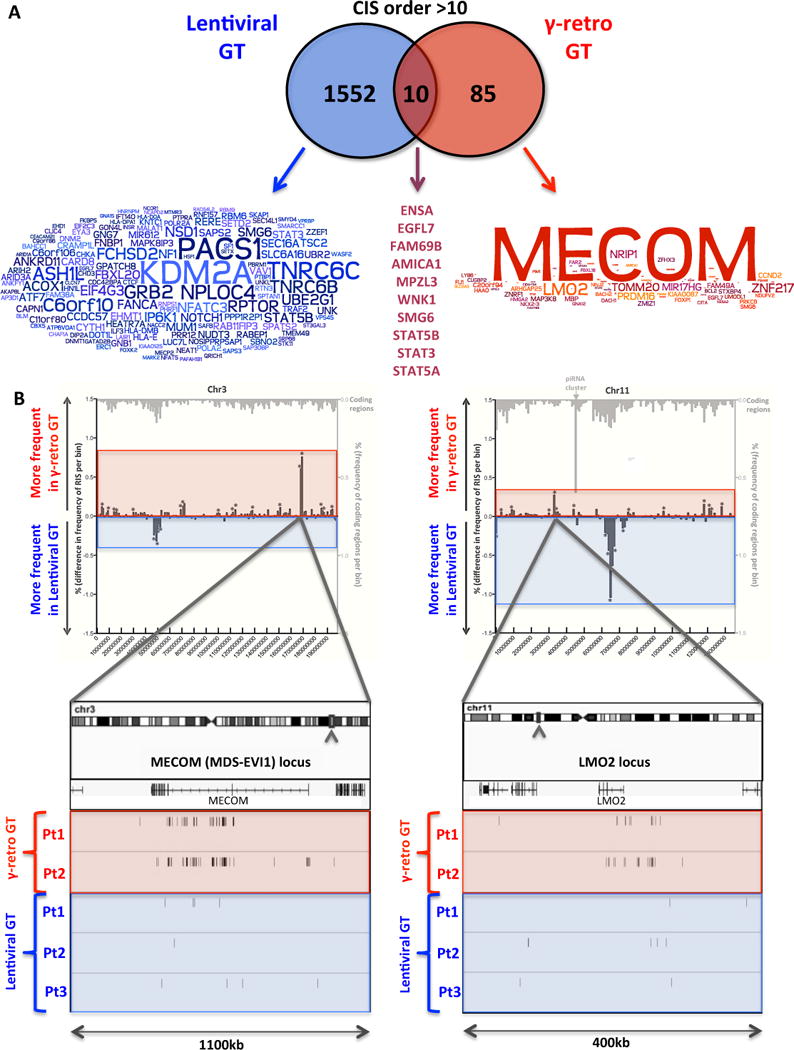
(A) Overlaps among CIS genes in lentiviral and γ-retroviral gene therapy. Genes proximal to CIS of order >10 are reported in the overlapping circles for lentiviral and γ-retro gene therapy (blue and red, respectively). Word clouds show the intensity of ISs clustering in each of the CIS gene (the bigger the gene name the higher the number of ISs inside or in the proximity of that gene). The names of the 6 CIS genes detected in both gene therapy trials are reported on the right at the intersection between the circles. (B) Incidence of ISs at two oncogenes in patients treated with lentiviral or γ-retroviral gene therapy. The comparative frequency distributions of insertions from lentiviral and γ-retroviral gene therapy in bins of 2kb are shown for chromosome 3 (left panel) and 11 (right panel). Mirror graph shows for each bin more frequent insertions in γ-retroviral gene therapy (columns above X-axis) and more frequent insertions in lentiviral gene therapy (columns below X-axis) (*p<0.05 Fisher exact test). Light grey columns on top show transcriptional units frequency for the same bins. Boxes on bottom show a detail of MECOM and LMO2 loci where ISs from the three lentiviral and two retroviral gene therapy patients are shown as sticks below the gene transcript. Raw IS data from the patients treated with the γ-retroviral vector were generated by Boztug et al (12) and re-processed through our informatic pipeline (Table SOM3).