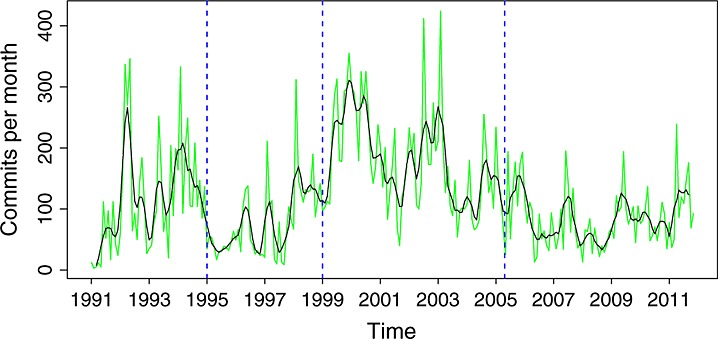
Figure 1.

Commits per month in the source code management repository (all branches). In green is the actual data. In black is a smoothed version of it (using a two-sided moving average).

Commits per month in the source code management repository (all branches). In green is the actual data. In black is a smoothed version of it (using a two-sided moving average).