Figure 13.

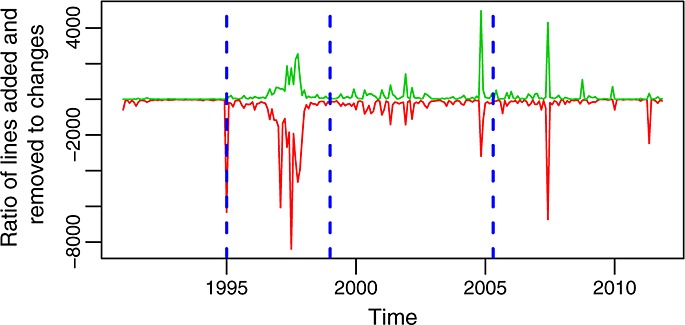
Ratio of lines added (red, bottom curve) and removed (green, top curve) to commits per month in the master branch. This is also the evolution of the mean number of lines added and removed per commit.

Ratio of lines added (red, bottom curve) and removed (green, top curve) to commits per month in the master branch. This is also the evolution of the mean number of lines added and removed per commit.