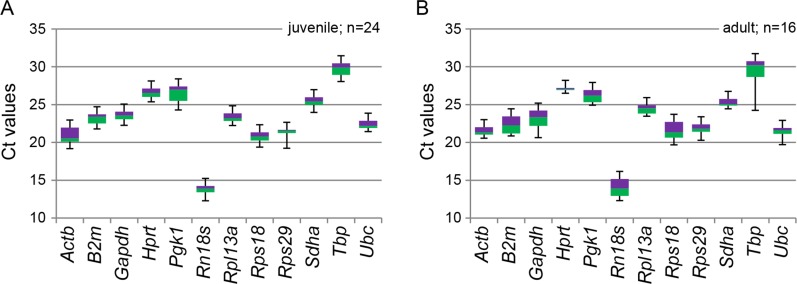
Figure 1. Box plot representation of RT-qPCR threshold (Ct) values of 12 reference genes in rat tissues.
The reference genes were assayed across rat tissue cDNA samples, with each box plot representing the biological replicates. (A) Box plot of 24 juvenile rat tissues; 4 each of liver, fat pad, adrenal, prostate, testis and ovary. (B) Box plot of 16 adult rat tissues; 4 each of liver, fat pad, prostate and testis. Boxes denote median values with upper and lower quartiles, and whiskers minimum and maximum outliers.

