Figure 3.
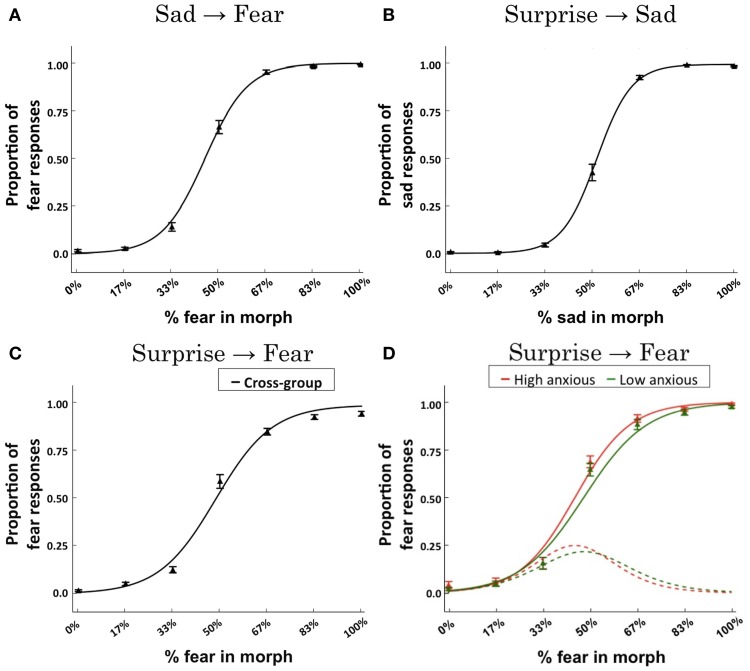
Behavioral results. Logistic regression fits across subjects for each of the expression continua: (A) sad-fear; (B) surprise-sad; (C) surprise-fear. Data points indicate the mean proportion of responses across subjects (±SEM) made for each expression morph with reference to the right-ward (“B”) end of the continuum—i.e., proportion of fear responses for the sad-fear and surprise-fear continua, proportion of sad responses for the surprise-sad continuum. The solid line represents the logistic regression fit to the group data. (D) A mixed effects logistic regression model revealed an interaction of trait anxiety x morph content (% fear in morph) for the surprise-fear continuum, β = 0.056, p = 0.0248. To illustrate the effect of anxiety upon categorization responses as a function of morph level, the logistic regression fit is presented for trait anxiety levels ±two standard deviations from the mean (this corresponds to scores of 20 and 59, respectively, the mean STAI trait score being 39.5, SD = 9.75). These fits are plotted using solid lines. Red = high anxious. Green = low anxious. The derivatives of these fitted functions (which gives the rate of change in responses from surprise to fear) are presented using dotted lines. Data points (triangles) for individuals with trait anxiety scores in the top tertile (red) and bottom tertile (green) of the group are also shown. It can be seen that heightened anxiety is associated with a more rapid transition from surprise to fear responses with this difference emerging for morphs with 33–50% fear content (see the derivative plots) and leading to more fear responses being made by high anxious individuals until high levels of fear content (83–100%) are reached, at which point both high and low trait anxious individuals predominantly make fear judgments (see the main fits).

