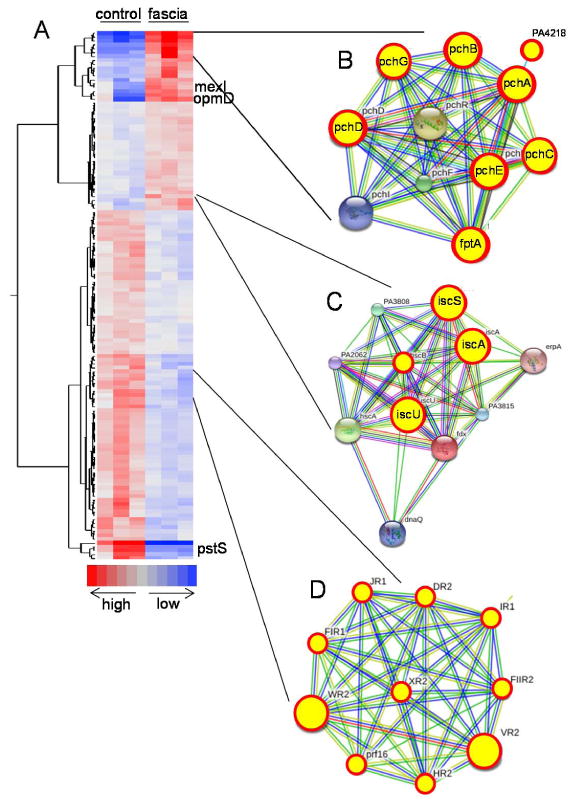
Figure 5. Transcriptional response in P. aeruginosa to fascia.

(A) Heat map generated from microarray data depicts specific pattern of gene clusters involved in the activation of pyochelin biosynthesis (B), and iron-sulfur cluster biogenesis (C), while suppression of bacteriophage genes (D). B, C, and D represent gene clusters with predicted functional links retrieved from a Search Tool for the Retrieval of Interacting Genes/Proteins (STRING 9.1). Genes in circular red yellow circles represent genes with alter expression in the response to fascia.
