
Fig. 3.
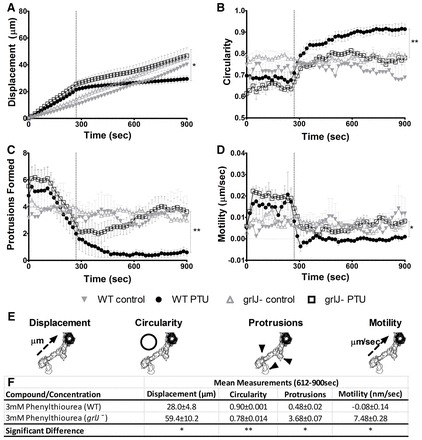
Random cell movement of WT and grlJ− Dictyostelium. After 288 seconds, 3 mM phenylthiourea was added and cells were monitored for the remainder of the assay. (A) A significant (P = 0.0228) difference in displacement at the final cumulative time point was observed between WT and grlJ− cells. (B) WT cells were found to show significantly (P<0.0085) increased circularity compared with grlJ− cells during the final 612–900 seconds. (C) Number of protrusions within a 10 frame window. Significantly (P = 0.0101) fewer protrusions were formed in WT cells than grlJ− cells during the final 612–900 seconds. (D) WT cells were found to be significantly (P<0.0146) less active than grlJ− cells during the final 612–900 seconds. (E) Image overlays of WT cells showing quantification of measurements taken over the course of the assay. (F) Data quantification showing mean measurements taken during the final 612–900 seconds of the assay for displacement, circularity, number of protrusions and motility. In all measurements, no significant difference was observed between WT and grlJ− cells under control conditions (0–288 seconds). Measurements were derived from an average of 40 cells measured from quadruplicate experiments. Error bars represent ± s.e.m.; *P<0.05, **P<0.01, ***P<0.001.