
Fig. 4.
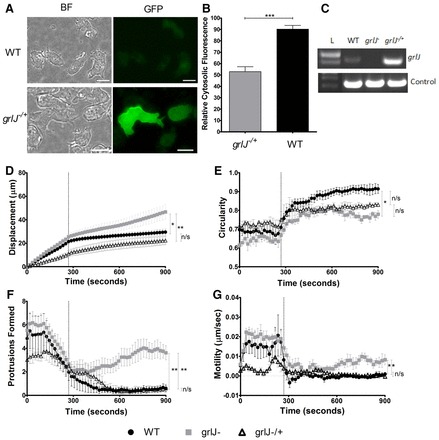
GrlJ overexpression in Dictyostelium. (A) grlJ−/+ cells showed membrane-bound GFP fluorescence when compared with WT cells containing an empty GFP vector. BF, brightfield. Scale bars: 10 µM. (B) Quantification of membrane fluorescence showed significantly less cytosolic fluorescence observed in grlJ−/+ cells. (C) RT-PCR showing grlJ gene expression in both WT and grlJ−/+ but not grlJ− cell lines. Control bands represent constitutively active gene, IG7. (D–G) During random cell movement, 3 mM phenylthiourea was added to cells after 288 seconds. Changes in cell behaviour were monitored and a one-way ANOVA with subsequent post-hoc Tukey's test was performed. As shown in D, a significant difference in the means (P = 0.0067) was observed at the final cumulative time point of the displacement assay between WT and grlJ− (P<0.05) as well as grlJ− and grlJ−/+ (P<0.01) cell lines. As shown in E, a significant difference in the means (P = 0.0060) was observed and WT cells were found to show a significant (P<0.05) increase in circularity compared with grlJ− cells during the final 612–900 seconds. As shown in F, number of protrusions detected within a running window of 10 time points (subsequently, affects of phenylthiourea are apparent before 288 sec). Significant (P = 0.0026) variance between cell lines was shown with both WT and grlJ−/+ cell lines producing significantly fewer protrusions compared with grlJ− cells during the final 612–900 seconds. As shown in G, a significant (P = 0.0083) variance was found between cell lines, with post-hoc analysis showing WT and grlJ−/+ cells to be significantly (P<0.05) less active than grlJ− cells during the final 612–900 seconds. In all measurements, no significant difference was observed between WT, grlJ− and grlJ−/+ cells under control conditions (0–288 seconds). Measurements were derived from 30 cells measured from a minimum of triplicate experiments. Error bars represent ± s.e.m.; *P<0.05, **P<0.01, ***P<0.001.