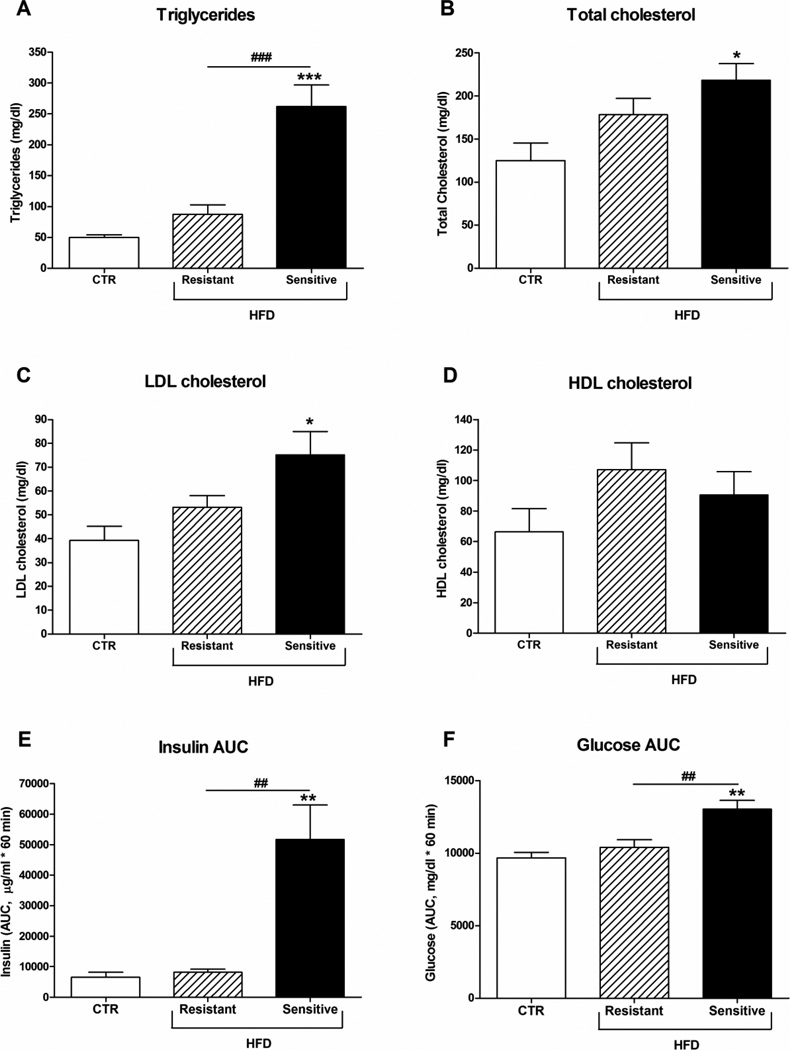
Figure 2. Lipid levels and GTT in rhesus monkeys on a high-fat diet.
Male rhesus monkeys on control diet or a high-fat diet to which they were either resistant or sensitive, n = 5/group. (A) Triglyceride, (B) cholesterol, (C) LDL and (D) HDL levels. (E) Insulin and (F) glucose area under the curve (AUC) after an i.v. GTT. Data are means ± SEM; *p < 0.05, **p < 0.01, ***p < 0.0001 versus control fed rhesus monkeys; ##P < 0.01, ###P < 0.0001.

